Statistics Unit 1-6

Statistics Mastery Quiz
Test your knowledge of statistics with this comprehensive quiz covering Units 1-6. Designed for students and enthusiasts alike, it assesses your understanding of essential statistical concepts.
- 67 questions across various statistics topics
- Multiple choice format for easy navigation
- Immediate feedback on your answers
What is a sample?
A sample is a subset of units of the population of interest. It is just a portion of the population.
A sample is a classification population chosen.
A sample is the whole population chosen.
There are two branches of statistics: what are they?
Descriptive statistics
Inferential statistics
Sample statistics
Populative statistics
What is Descriptive statistics?
Organize, summarize, and communicate numerical information. ◦ We make claims about the sample.
Using representative sample data, we draw conclusions (we make inferences) about a population. ◦ We make claims about the population.
What is inferential statistics?
Organize, summarize, and communicate numerical information. ◦ We make claims about the sample.
Using representative sample data, we draw conclusions (we make inferences) about a population. ◦ We make claims about the population.
Descriptive statistics:We measure the height (in cm) of 50 UEM stuents at random. Mean=170, S.D=10. What does this describe?
It describes the average height and variability in that group of 50 students.
It describes the mean in the group og 50 students.
It describes the mode for the 50 students.
What is a variable?
Any observation that can take on different values in different circumstances.
An observation made up and given a value.
Type of Variables: What is Discrete?
Variables that can only take on whole numbers (0, 1, 2, 3..) ◦ Number of students
Can take on almost any numerical value using decimals (1,0; 1,1; 1.2; 1.3; 1.4... or 1.01; 1.02; 1.03; 1.04; 1.05...) ◦ Weight
Type of Variables: what is Continous?
Variables that can only take on whole numbers (0, 1, 2, 3..) ◦ Number of students
Can take on almost any numerical value using decimals (1,0; 1,1; 1.2; 1.3; 1.4... or 1.01; 1.02; 1.03; 1.04; 1.05...) ◦ Weight
Type of Variables/ Categorical variables: What is Nominal?
Category or name ◦ Unordered categories Examples: field of study, the city in which a person lives, marital status, blood type.
� Ordered categories ◦ Examples: educational level, rank in the military, ratings (good, average, poor)
Ranking of data
Type of Variables/ Categorical variables: What is Ordinal?
Ranking of data ◦ Ordered categories Examples: educational level, rank in the military, ratings (good, average, poor)
Unordered categories ◦ Examples: field of study, the city in which a person lives, marital status, blood type.
They are also known as scale variables.
Type of variables/ Quantitative variables: What is Interval?
used with numbers that are equally spaced. Zeros are not meaningful. ◦ Examples: IQ score
Zero has meaning (absence of the thing you are measuring). ◦ Examples: drug dosage in mg.,
They are also known as scale variables.
Type of variables/ Quantitative variables: what is Ratio?
Zero has meaning (absence of the thing you are measuring). ◦ Examples: drug dosage in mg.,
Used with numbers that are equally spaced. Zeros are not meaningful. ◦ Examples: IQ score
They are also known as scale variables.
What can be an example of Nominal? More than one can be correct.
Nationalities: How many people come from France? How many from Spain?
Marital status: how many people are married? Single? Divorced?
We can only count the number of observations in each category and report that number.
We can count many numbers and put them into the category for the mean.
What can be an example of Ordinal? More than one can be correct.
We can only rank observations
Educational level: primary school, secondary school, bachelor degree, masters, PhD.
A person with a bachelor degree has a highest level of education than a person who only completed secondary school
We only rank the numbers we predict.
What can be an example of Interval? More than one can be correct.
We can calculate differences in values, because numbers are meaningful and equally spaced.
IQ score
A person with an IQ = 110 is 10 points above the mean (100). 110-100 = 10
All are correct.
What can be an example of Ratio? More than one can be correct.
Same properties as interval data, but we can also multiply and divide values.
Example: number of hours of study o Sam studies for 6 hours; Alex studies for 2 hours. o Sam studied 4 hours more than Alex o And also Sam studied 3 times as much as Alex.
Which ones of these are categorical? More than one answer can be correct.
Nominal
Ordinal
Interval
Ratio
None
Which ones of these are Quantitative? More than one answer can be correct.
Nominal
Ordinal
Interval
Ratio
What is an independent variable?
Variable that we manipulate or use to categorize.
Variable that we want to understand.
Variable that we want to study.
What is an dependent variable?
Variable that we want to understand.
Variable that we manipulate or use to categorize.
Variable that we want to study and categorize.
What is Independent variable known as?
Predictor
Mode
Mean
Categori
What is a Dependent variable known as?
Predictor
Mean
Mode
Outcome
Categori
What is an experiment? More than one can be correct.
Could be anything you want to know more about and study.
Studies in which participants are randomly assigned to a condition (or level) of one or more independent variables.
Experiment is when you study the participants doing a task and then calculate the mean.
What is a Quasi- experiment? More than one can be correct.
Similar to an experimental design but groups are not randomly created.
Experiment is when you study the participants doing a task and then calculate the mean.
Could be anything you want to know more about and study.
What are correlational studies? More than one can be correct.
Do not manipulate either variable.
Variables are assessed as they exist.
We look for relationships between two or more variables.
Cannot determine causality.
What is the definition of Confounding or lurking variables? More than one can be correct.
Variables that systematically vary with the independent variable so that we cannot determine which variable is a work.
We will need to control for them or randomize them away
Systematically confound numbers and study them.
Is this an example of Confounding? Example: a recent study found that people who engage in cultural activities (going to museums, going to the opera, cinema) lived longer than people who did not do so. ◦ Dependent variable: life expectancy ◦ Independent variable: engaging in cultural activities
Yes
No
What is descriptive statistics?
The branch of statistics that focuses on collecting, summarizing and presenting numerical information.
The descriptives of collecting information and other summarizes.
We can divide descriptive statistics into two branches: what are they?
Visual summaries
Non- visual summaries
Measures of location and dispersion, numerical summaries for data sets.
Measures of data and dispersion.
The variable "number of mistakes" comitted by a participant during a task is an example of?
Ordinal variable
Ratio variable
Interval variable
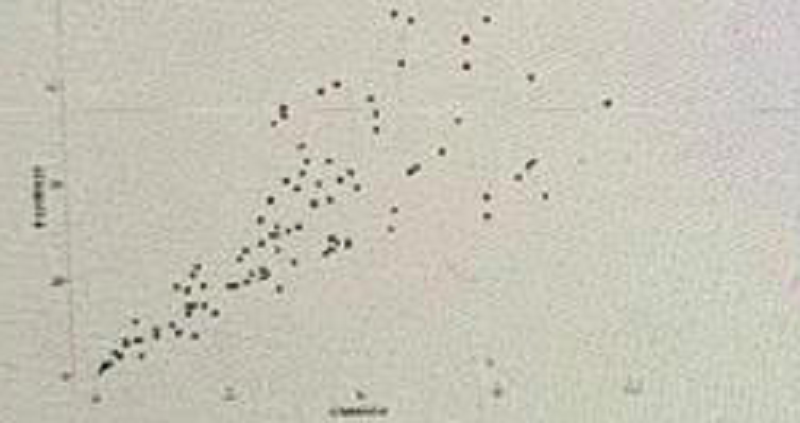
Take a look at the scatterplt. What can be said about chocolate and happiness?
Happiness makes you eat more chocolate
Chocolate causes happiness
People who eat more chocolate are happier
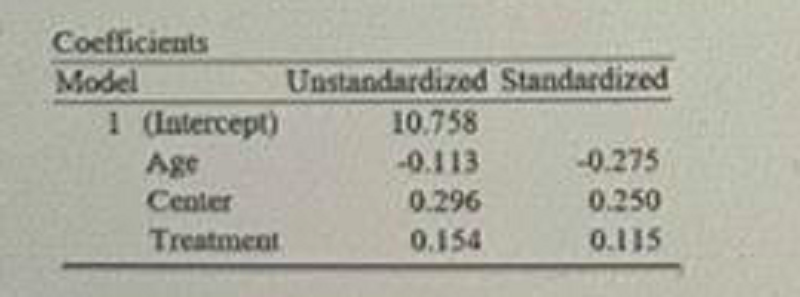
Considering the results presented in the table, select the statement that is true:
Age is the best predictor of the dependent variable.
Center is the best predictor of the dependent variable.
Treatment is the best predictor of the dependent variable.
A patient has a z- score= 2 in depression severity, this means that:
He is 2 point more depressed than his normative group.
He is twice as depressed as the normal population.
He is 2 standard deviations above his normative group.
Consider this regression equation y= 12+ (0.25*x) and select the correct statement.
The intercept is equal to 0.25
The regression coefficient is equal to 0.25
The independent varianle is equal to 0.25

Consider the results presented in the table and select the statement that is true:
We reject the null hypothesis (with a - 0.05)
We retain the null hypothesis (with a= 0.05)
We reject the alternative hypothesis (with a- 0.05)
If we retain a null hypothesis that is false in the population, we have comitted:
Type II error
Type I error
No error
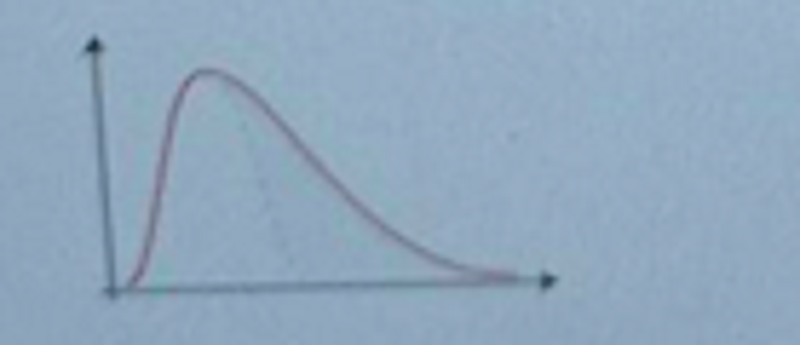
What type of pattern displays the plot?
Positive skewness
Negative skewness
No skewness
We want to study the effect of "age" on "depression severity". What is "age" in this context?
The dependent variable
The independent variable
The outcome
A p- value= 0.03 indicates that:
The probability that the null hypothesis is true in the population is 0.03
The probability that the alternative hypothesis is false in the population is 0.03
There is a probability of 0.03 of obtaining the test statistic that we obtained if the null hypothesis is true in the population.
What is a parameter?
A value that refers to the population.
A value that summarizes a dataset.
A value that summarized the observed sample.
We want to compare the depression levels of two different groups: a treatment group and a control group. What statistical test should we use?
A paired sampled t- test.
An independent sample t- test.
A one sample t- test.
What does it mean for a person to be in the 70th percentile of depression scores?
He scored higher than 70% of the people who took the test.
He scored lower than 70% of the people who took the test.
30% of the people who took the test scored lower than he did.
What is the best measure to summarize data that presents outliers?
The mean
The median
The variance
What index do we use to compare different regression equations (or regression models)?
The intercept
Adjusted R2
Standardized coefficients

Considering the table of results, select the statement that is true:
The dependent variable increases by 2.5 units when stress increases by one unit.
The dependent variable decreases by 2.5 standard deviations when stress increases by one unit.
The dependent variable increases by 2.5 units when stress increases by one standard deviation.
We have measured the "anxiety levels" of patients at four different points in time. What statistical technique should we use to test for differences among the four measurements?
A paired samples t- test
A repeated measures ANOVA
A multiple regression model
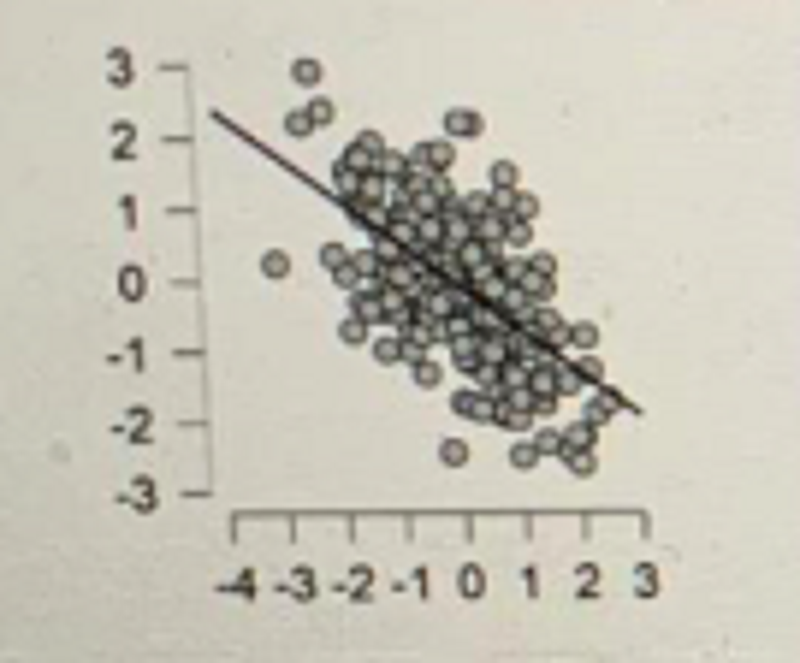
What is the relationship between the two variables represented in the scatterplot?
Moderately strong and positive
Moderately strong and negative
Cannot be said
We are studying the effect of a new drug on sleep disorders. We have two groups: an experimental group that gets the new treatment and a control group that gets placebo. Select the statement that is true:
The new drug is the dependent variable
The treatment recieved is the independent variable.
There are no independent and dependent variables in this experiment.
We want to study the effectiveness of cognitive therapy on anxiety. The alternative hypothesis is: ha: M treatment < M control, select the correct null hypothesis in this case:
Ho: M treatment ≥ M control
Ho: M treatment ≠ M control
Ho: M treatment ≤ M control
A randomly chosen group of 35 students from UEM is a:
Population of students
Dataset of students
Cohort of students
Sample of students

What is the relationship between these two variables?
Linear and positive
Curvilinear and negative
Linear and negative
Curvilinear and positive
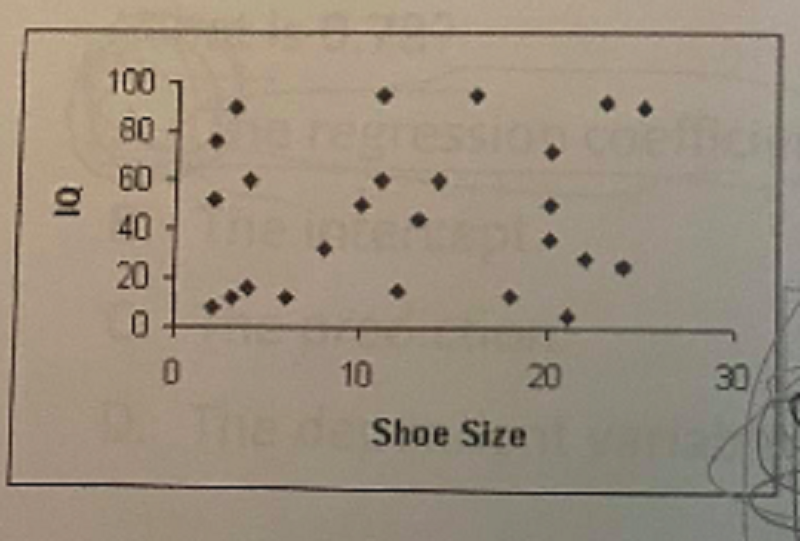
Whats the relationship between shoe size and IQ?
Positive and moderately strong
Negative and moderately strong
Curvlinear and moderately strong
There is no clear relationship
A measure of the variability of two variables taken together is the:
Variance
Standar deviation
Covariance
Range
Consider the following information and select the statement that is true:
Depression levels are high in the sample
Depression levels are low in the sample.
Most people are between 28.5 and 35.5 years of age.
Most people are below 32 years of age.
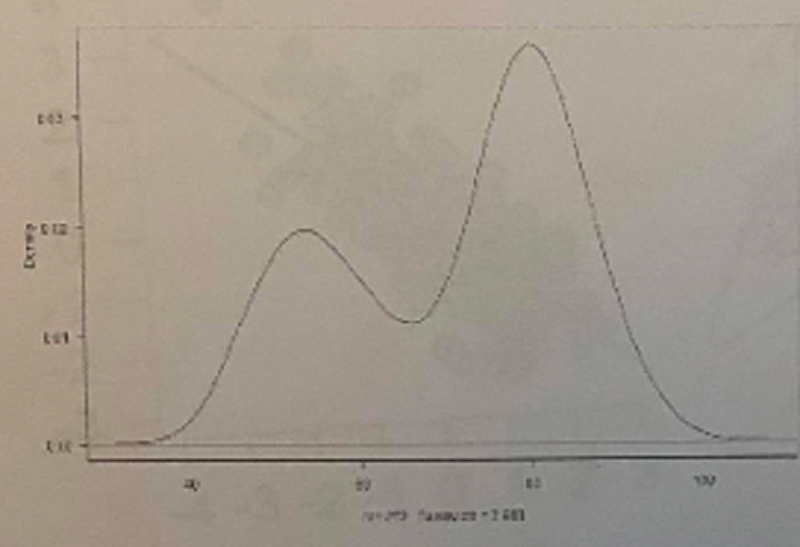
What is the shape of this distribution?
Unimodal
Bivariate
Bimodal
Normal with two peaks
A person has a z- score= 1.5 in extroversion, this means that:
He scored 1.5 in extroversion
He is 1.5 point more extroverted than his normative group.
He is 1.5 times more extroverted than his normative group.
He is 1.5 standard deviations above his normative group.
You have measured the height of 100 students, what is the best way to summarize this information?
Calculating the mode
Calculating the covariance
Calculating the mean
Calculating the regression equation
We use a density plot when:
We want to represent the dependent variable and independent variable
We have a dependent variable that is continous
We want to represent the frequency of the dependent variable
What can be said about Pearsons r equal to -0.25?
A positive and weak relationship
Negative and weak relationship
Positive and strong relationship
A patient has a z- score= 1.75 in anxiety, we can say that:
She is in the normal range of anxiety compared to her normative group.
She is moderately anxious compared to her normative group.
She is very anxious compared to her normative group.
We are interested in studying the relationship between using dating apps and certain personality traits: and this context, all the people who use dating apps are the:
Sample
Subsample
Population
Participants
What can you NOT use when analyzing nominal variables?
Relative frequencies
Frequency table
Median
Mode
Consider this regression equation: y= 1.25 + 0.78 * x What is 0.78?
The regression coefficient
The intercept
The prediction
The dependent variable
We want to study the effect of "age" in depression severity. What is "age" in this context?
The outcome
The confounding variable
The dependent variable
The independent variable
Time measured in minutes can be considered a:
Ordinal variable
Interval variable
Ratio variable
What does it mean for a person to be in the 70th percentile of depression scores?
He is 70% more depressed than the other people who took the test.
He scored a 70 out of 100 in the test.
He scored higher than 70% of the people who took the test.
The correlation between "neuroticism" and "anxiety" is 0.65, we can say that:
People who scored high in neuroticism scored low in anxiety.
People who scored high in neuroticism scored high in anxiety.
High anxiety levels are the cause of neuroticism.
{"name":"Statistics Unit 1-6", "url":"https://www.quiz-maker.com/QPREVIEW","txt":"Test your knowledge of statistics with this comprehensive quiz covering Units 1-6. Designed for students and enthusiasts alike, it assesses your understanding of essential statistical concepts.67 questions across various statistics topicsMultiple choice format for easy navigationImmediate feedback on your answers","img":"https:/images/course7.png"}
More Quizzes
Stats Practice quiz.
201035
Statistic Analysis Quiz 1
10524
Nicholas Sparks Films
630
Contemporary arts
20107
Alkaline Perms - Test Your Permanent Waving Knowledge
201020997
Crucial Conversations Practice Test - Free Online
201017327
Am I Creative? Free to Test Your Imagination
201017523
Nervous System Multiple Choice - 10 Questions
201019347
Phobia Trivia - Can You Name These Fears?
201018762
Australian Sports Trivia - Play Free Online
201018683
The Cell - Chapter 6: A Tour of the Cell
201019347
Gone With the Wind - How Well Do You Know the Film?
201017657