
Module 4
The Keynesian model suggests that
Any measure of planned spending is a good candidate to be a leading economic indicator
Balancing the government's budget will increase real GDP
The money stock is a leading economic indicator
Interest rates will be leading economic indicators
The inventory-to-sales ratio
Began to systematically decrease during the early 1990’s.
Has remained fairly stable since the mid-1980's except that it decreases during recessions and increases during recoveries
Began to systematically increase during the early 1990's
Tends to increase when firms improve their ability to handle inventories
Each choice below is a set of three economic indicators. Which set includes three indicators that tend to lead business cycle peaks?
The purchasing managers’ composite index, new housing units authorized by building permits, and total capacity utilization
The purchasing managers’ composite index, gdp, and total capacity utilization
The purchasing managers’ composite index, cpi, and total capacity utilization
If capacity utilization is relatively high it means
Then firms will experience an increase in costs as they increase production
Then firms can increase production without experiencing rising costs
If capacity utilization is relatively low it means
Then firms will experience an increase in costs as they increase production
Then firms can increase production without experiencing rising costs
The inventory-to-sales ratio
Is an inverted series.
Has remained fairly stable since the mid-1980's except that it decreases during recessions and increases during recoveries
Began to systematically increase during the early 1990's
Tends to increase when firms improve their ability to handle inventories
The change in business inventories
Tends to be a leading economic indicator for both business-cycle peaks and troughs
Tends to be a lagging economic indicator for both buiness-cycle peaks and troughs
Tends to be a leading economic indicator for both business-cycle peaks
Tends to be a leading economic indicator for business-cycle troughs
Which of the following components of the ISM’s purchasing manager’s (composite) index is a component of the index of leading economic indicators?
Supplier deliveries
New orders

In the figure which series looks most like the unemployment rate?
A
B
C
D
Suppose you observe that over the last four months the unemployment rate has increased from 5% to 6%, while total employment (in all private industries) and the index of industrial production have each decreased by about 2%. These observations suggest:
The economy might already be in a recession since total employment and industrial production are coincident with business cycle peaks.
The economy soon might enter a recession, especially is the trends in these variable continue.
The economy is in a recovery because all three variables lag business cycle troughs.
Nothing, because the information in the three series are contradictory
If supplier deliveries in July were faster relative to deliveries in June, then
It implies that the economy was expanding more slowly in July that it was in June.
It implies that the economy was expanding faster in July than in was in June.
It implies nothing because we don't know whether the index was about 50 in July.
It tells us that the economy is picking up speed, so unemployment should go down.
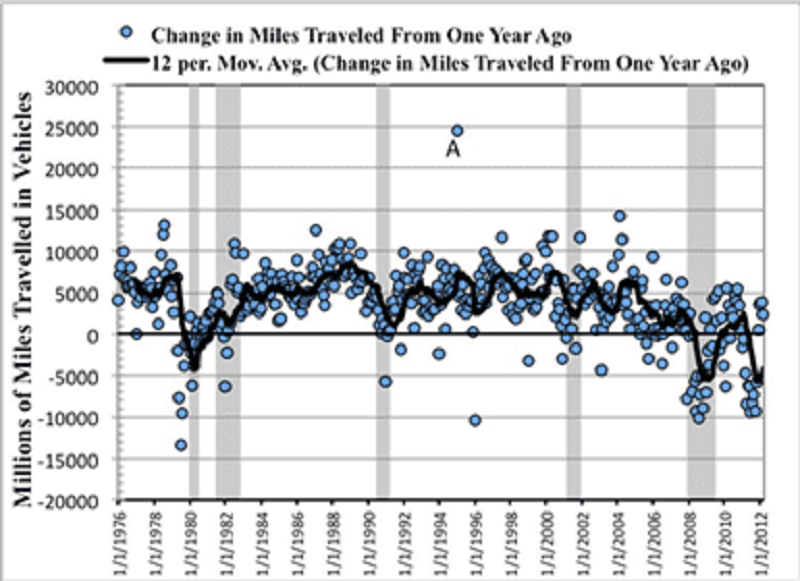
The blue circles in the above figure present monthly observations on the change from a year ago in the number of miles travelled in vehicles in the United States from January 1976 to March 2012. For example the data point marked “A” states that in January 1995 Americans drove 25,000 million miles more than they did in January 1994. The data are not seasonally adjusted, so a 12-month moving average has been added to the figure. From looking at the figure it is apparent that
The change from a year ago in miles traveled by light vehicles has become negative for at least one month in every recession shown in the graph.
The change from a year ago in miles traveled by light vehicles has never become negative without there being a recession.
Although the moving average of the change in miles traveled by light vehicles tends to lead business cycle peaks, it tends to lag troughs.
The moving average of the change in miles traveled by light vehicles only declines if there is going to be a recession.
�Manufacturers’ new orders: durable goods” represents
Actual spending on durable goods
Only an intention to spend because orders can be canceled
What happened in the recent past and so they are not very interesting
The capital goods that firms intend to install
If an economic indicator is very volatile on a month-to-month basis, then
It is best to look at a moving average of the series rather than the series itself to find meaningful peaks and troughs associated with business cycle peaks and troughs.
It is practically impossible to use it as an economic indicator.
It is only useful if it is a coincident economic indicator.
Looking at the change in the series will make it smoother and easier to interpret.
Suppose 100 manufacturing firms are surveyed on supplier deliveries during July. 30 say that supplier deliveries are faster than June, 50 say that they are slower than June and only 20 report no change. The diffusion index for supplier deliveries in July is
40
60
50
70
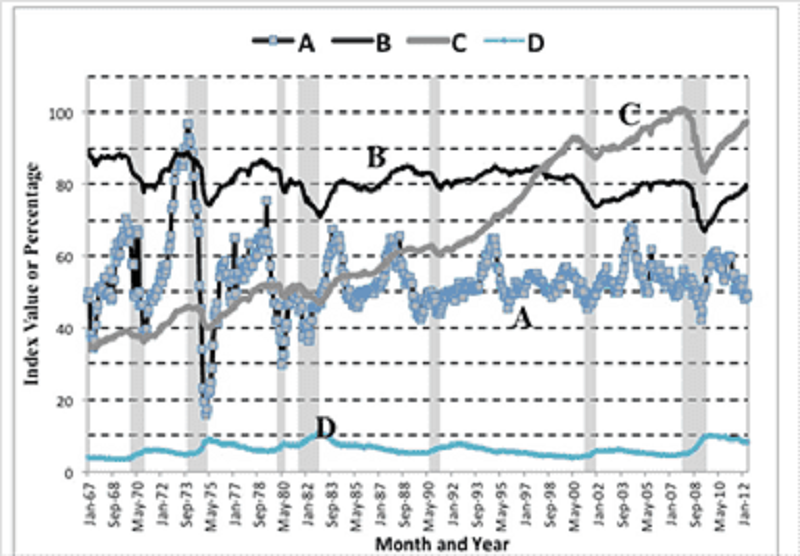
In the figure which series looks most like the index of industrial production?
A
B
C
D

In the figure which series looks most like total capacity utilization?
A
B
C
D
If total planned expenditure exceeds current output (E>Y), then
The inventory-to-sales ratio will decrease.
Incomes will begin to decrease.
The inventory-to-sales ratio will increase.
Business inventories will increase.
Which of the following statements about building permits is false?
Building permits are so volatile on a month-to-month basis that financial markets don’t’ pay attention to them.
Because permits are relatively inexpensive, builders are willing to buy them even if they have not made a final decision to build.
Building permits are clearly a leading economic indicator
Not all buildings authorized to be constructed by building permits are actually built because occasionally adverse movements in interest rates occur.
�Manufacturers’ new orders: durable goods” measures
Excludes aircrafts nondefense capital goods
new orders for machinery and equipment made by United States manufacturing firms
Orders for durable goods by customers
New orders for durable goods from United States manufactures
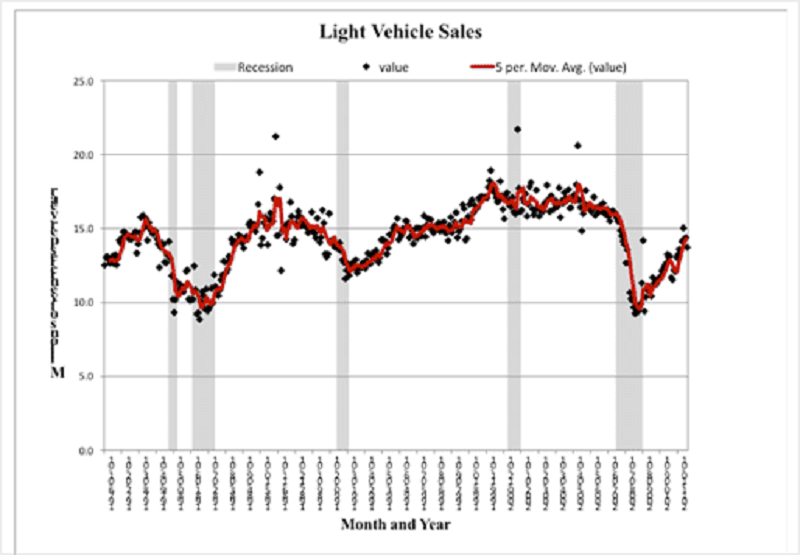
The graph above is a plot of Light Weight Vehicle sales in the United States. In the graph the diamonds are the monthly value (expressed in units per year) and the red line is a moving average. From the figure it looks like
Light weight vehicle sales are a coincident economic indicator for both business cycle peaks and troughs
Light weight vehicle sales lead business-cycle peaks and tend to lead troughs by one or two months.
Light weight vehicle sales are a lagging economic indicator for recessions
Light weight vehicle sales lag business-cycle peaks and tend to lag business cycle troughs by one or two months.
Suppose the index of industrial capacity increases from June to July, while the index of industrial production decreases from June to July. This implies
There was under-production during July
The rate of capacity utilization declined during July
The rate of capacity utilization increased during July
There was too much investment in industrial capacity during July

In the figure which series looks most like a diffusion index?
A
B
C
D
The Fed began to measure capacity utilization because
It needed a measure to give it help identifying whether the rate of inflation is going to increase.
It needed another leading economic indicator.
It needed a measure to help predict future levels of industrial production.
The lead times from industrial production to business cycle peaks were too volatile to be of use in forecasting recessions.
Suppose 100 manufacturing firms are surveyed on new orders during July. 30 say that new orders are larger than in June, 50 say that they are smaller than in June and only 20 report no change. The diffusion index for new orders in July is
40
50
60
70
Because building permits are “an intention to spend”
The Keynesian model suggests they are likely to be a leading economic indicator
They are not a very useful data series
They tell us less about the future than do housing starts
They focus on the past rather than the future
If the total planned expenditure is less than the current output (E<Y)
The inventory-to-sales ratio will start to increase
Incomes will begin to increase
The inventory-to-sales ratio will decrease
Business inventories will begin to decrease
{"name":"Module 4", "url":"https://www.quiz-maker.com/QPREVIEW","txt":"The Keynesian model suggests that, The inventory-to-sales ratio, Each choice below is a set of three economic indicators. Which set includes three indicators that tend to lead business cycle peaks?","img":"https://cdn.poll-maker.com/10-460279/mod4-1.png?sz=1200"}
More Quizzes
1360
Test na ja
420
Outer space
11661
Countries and Nationalities
105117
Electricity & Magnetism Unit Test: Free Challenge
201030846
Free Exam Practice to Boost Your Prep
201026118
Test Your DC Circuit Analysis Skills: Free Gibilisco
201036060
Take Our Fun Patronus and Reveal Your Magical Guardian
201037141
Ultimate Cell Cycle & DNA - Test Your Knowledge Now
201024554
Free Evidence of Evolution Quick Check
201022350
Romeo and Juliet Act 4: Test Your Dramatic Irony Skills
201069871
Entrepreneurship Questions for Students: Think Like a Founder
201028540