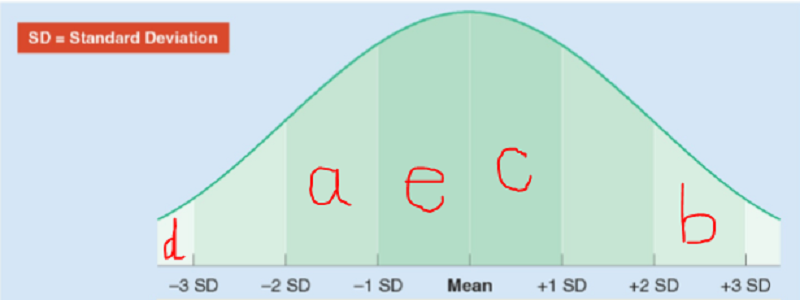
The Normal Bell Curve
{"name":"The Normal Bell Curve", "url":"https://www.quiz-maker.com/QPREVIEW","txt":"Test your knowledge about the Normal Bell Curve with this engaging quiz! Perfect for students, teachers, and anyone interested in statistics, this quiz will challenge your understanding of the bell curve, z-scores, and standard deviation.By participating, you will:Identify key concepts in statisticsUnderstand the significance of the normal distributionEnhance your statistical analysis skills","img":"https:/images/course1.png"}
More Quizzes
PEACEGATE INTERNATIONAL SCHOOL ONLINE MATHS QUIZ
11639
Test 1
15823
Amanda
100
What type of trader am I?
840
Boost Your Math Skills: Free Quantitative Aptitude
201063312
Elizabethan Era Poetry: Test Your Classic Verse IQ
201038877
Free Memory Recall Test
201023996
Lab Safety Fundamentals
15820640
Master Commas and Coordinating Adjectives: Quick
201049391
Ultimate Easter Trivia: 201+ Questions
20110019427
Algebra 2 Practice Test: Ace Your Final Exam Challenge
201035539
Computer Architecture
15822899

