
DA-100 Exam

DA-100 Exam Preparation Quiz
Prepare yourself for the DA-100 Exam with our comprehensive quiz designed to test your knowledge and skills in data analysis using Microsoft Power BI. This quiz covers a variety of topics that are essential for mastering Power BI, including data modeling, DAX expressions, visualizations, and security configurations.
Take the challenge today and boost your confidence! Key features of the quiz:
- Multiple-choice questions
- Hotspot and drag-drop questions
- Immediate feedback on your responses
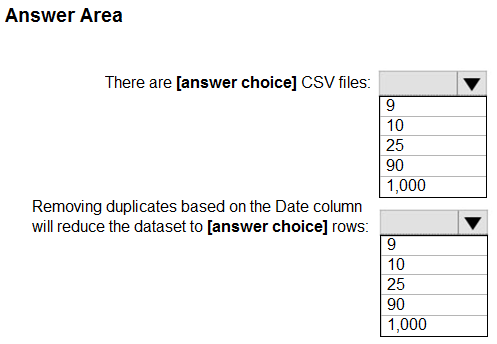
Orders and between City and Orders.
The model contains two row-level security (RLS) roles named Role1 and Role2. Role1 contains the following filter.
City[State Province] = "Kentucky"
Role2 contains the following filter.
Date[Calendar Year] = 2020 -
If a user is a member of both Role1 and Role2, what data will they see in a report that uses the model?
Your company has affiliates who help the company acquire customers.
You build a report for the affiliate managers at the company to assist them in understanding affiliate performance.
The managers request a visual showing the total sales value of the latest 50 transactions for each affiliate. You have a data model that contains the following tables.
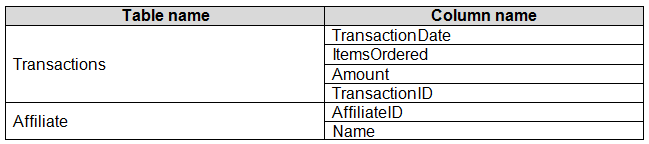
You need to develop a measure to support the visual.
How should you complete the DAX expression? To answer, select the appropriate options in the answer area.
NOTE: Each correct selection is worth one point.
Hot Area:
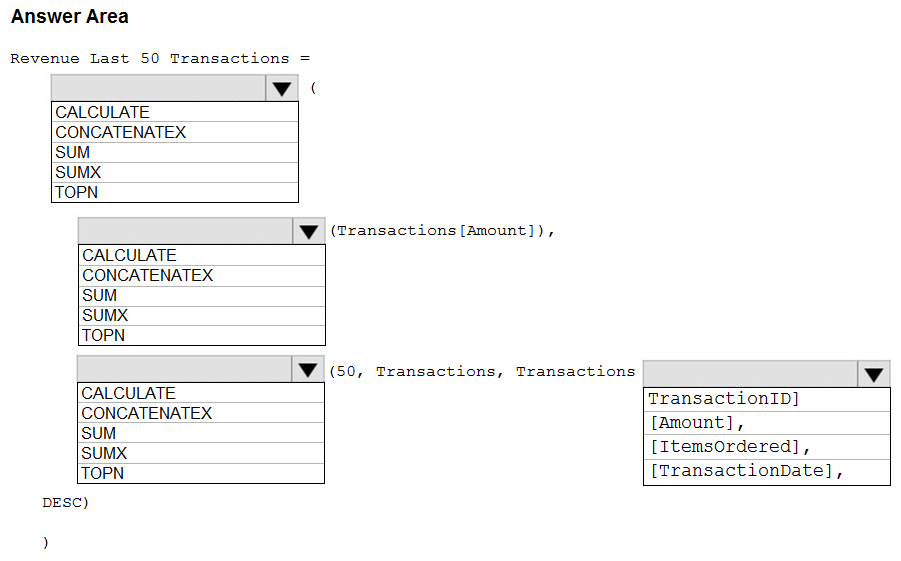
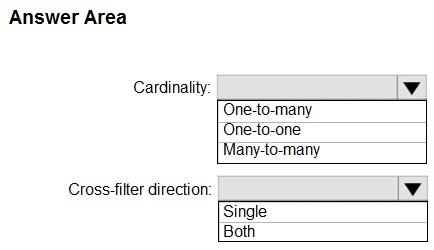
You are creating a Microsoft Power BI data model that has the tables shown in the following table.
The Products table is related to the ProductCategory table through the ProductCategoryID column.
You need to ensure that you can analyze sales by product category.
How should you configure the relationships from Products to ProductCategory? To answer, select the appropriate options in the answer area.
NOTE: Each correct selection is worth one point.
Hot Area:
HOTSPOT -
You are creating a quick measure as shown in the following exhibit.
You need to create a monthly rolling average measure for Sales over time.
How should you configure the quick measure calculation? To answer, select the appropriate options in the answer area.
NOTE: Each correct selection is worth one point.
Hot Area: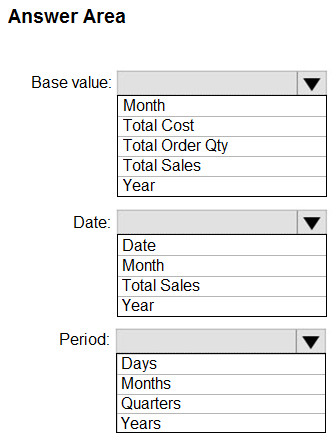
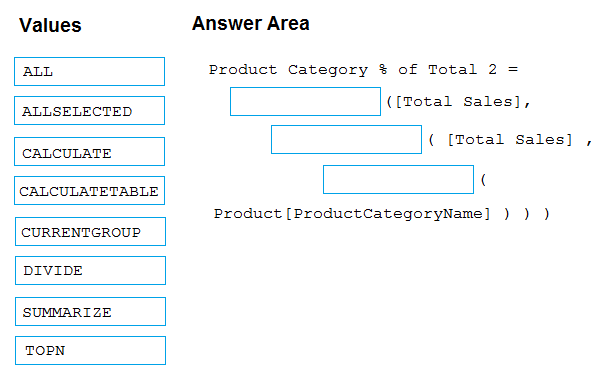
You have a Microsoft Power BI data model that contains three tables named Sales, Product, and Date.
The Sales table has an existing measure named [Total Sales] that sums the total sales from the Sales table.
You need to write a calculation that returns the percentage of total sales that a selected ProductCategoryName value represents. The calculation must respect any slicers on ProductCategoryName and must show the percentage of visible total sales. For example, if there are four ProductCategoryName values, and a user filters one out, a table showing ProductCategoryName and the calculation must sum up to 100 percent.
How should you complete the calculation? To answer, drag the appropriate values to the correct targets. Each value may be used once, more than once, or not at all. You may need to drag the split bar between panes or scroll to view content.
NOTE: Each correct selection is worth one point.
Select and Place:
After you answer a question in this scenario, you will NOT be able to return to it. As a result, these questions will not appear in the review screen.
You have a clustered bar chart that contains a measure named Salary as the value and a field named Employee as the axis. Salary is present in the data as numerical amount representing US dollars.
You need to create a reference line to show which employees are above the median salary.
Solution: You create a constant line and set the value to .5.
Does this meet the goal?
You need to modify the dashboard to appear as shown in the Modified Dashboard exhibit. (Click the Modified Dashboard tab.)
What should you do?
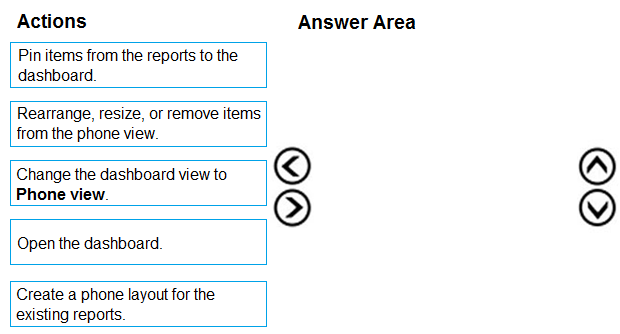
You are using existing reports to build a dashboard that will be viewed frequently in portrait mode on mobile phones.
You need to build the dashboard.
Which four actions should you perform in sequence? To answer, move the appropriate actions from the list of actions to the answer area and arrange them in the correct order.
Select and Place:
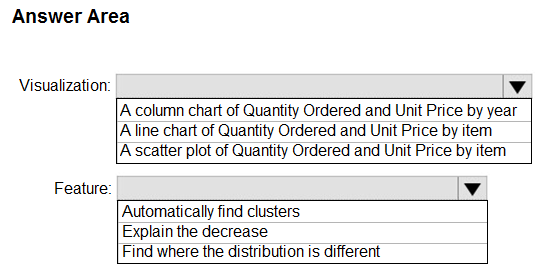
You have a dataset named Pens that contains the following columns:
✑ Unit Price
✑ Quantity Ordered
You need to create a visualization that shows the relationship between Unit Price and Quantity Ordered. The solution must highlight orders that have a similar unit price and ordered quantity.
Which type of visualization and which feature should you use? To answer, select the appropriate options in the answer area.
NOTE: Each correct selection is worth one point.
Hot Area:
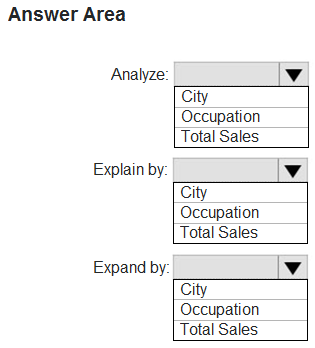
You have a table that contains the following three columns:
✑ City
✑ Total Sales
✑ Occupation
You need to create a key influencers visualization as shown in the exhibit. (Click the Exhibit tab.)
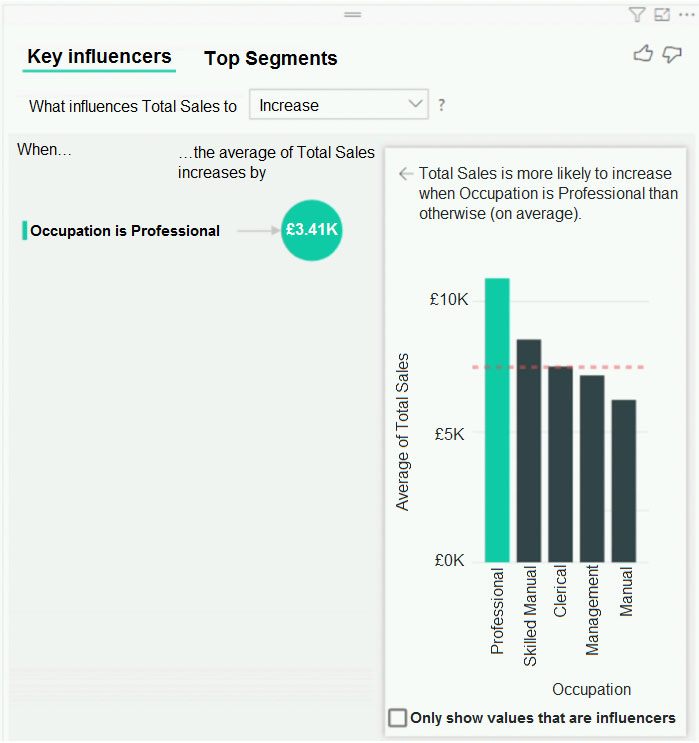
How should you configure the visualization? To answer, select the appropriate options in the answer area.
NOTE: Each correct selection is worth one point.
Hot Area:
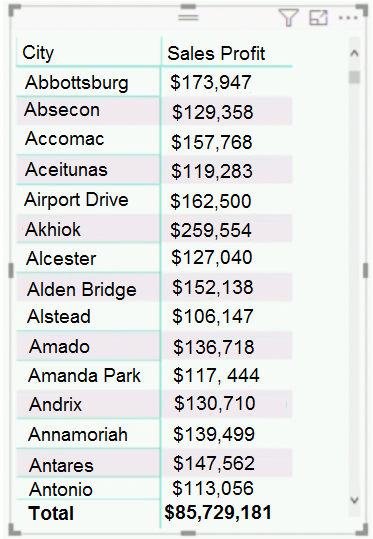
You need to ensure that the visual shows only the 10 cities that have the highest sales profit.
What should you do?
After you answer a question in this scenario, you will NOT be able to return to it. As a result, these questions will not appear in the review screen.
You have a clustered bar chart that contains a measure named Salary as the value and a field named Employee as the axis. Salary is present in the data as numerical amount representing US dollars.
You need to create a reference line to show which employees are above the median salary.
Solution: You create an average line by using the Salary measure.
Does this meet the goal?
After you answer a question in this scenario, you will NOT be able to return to it. As a result, these questions will not appear in the review screen.
You have a clustered bar chart that contains a measure named Salary as the value and a field named Employee as the axis. Salary is present in the data as numerical amount representing US dollars.
You need to create a reference line to show which employees are above the median salary.
Solution: You create a percentile line by using the Salary measure and set the percentile to 50%.
Does this meet the goal?
DRAG DROP -
You have a query named Customer that imports CSV files from a data lake. The query contains 500 rows as shown in the exhibit. (Click the Exhibit tab.)
Each file contains deltas of any new or modified rows from each load to the data lake. Multiple files can have the same customer ID.
You need to keep only the last modified row for each customer ID.
Which three actions should you perform in sequence? To answer, move the appropriate actions from the list of actions to the answer area and arrange them in the correct order.
Select and Place:
You view a query named Transactions as shown in the following exhibit.
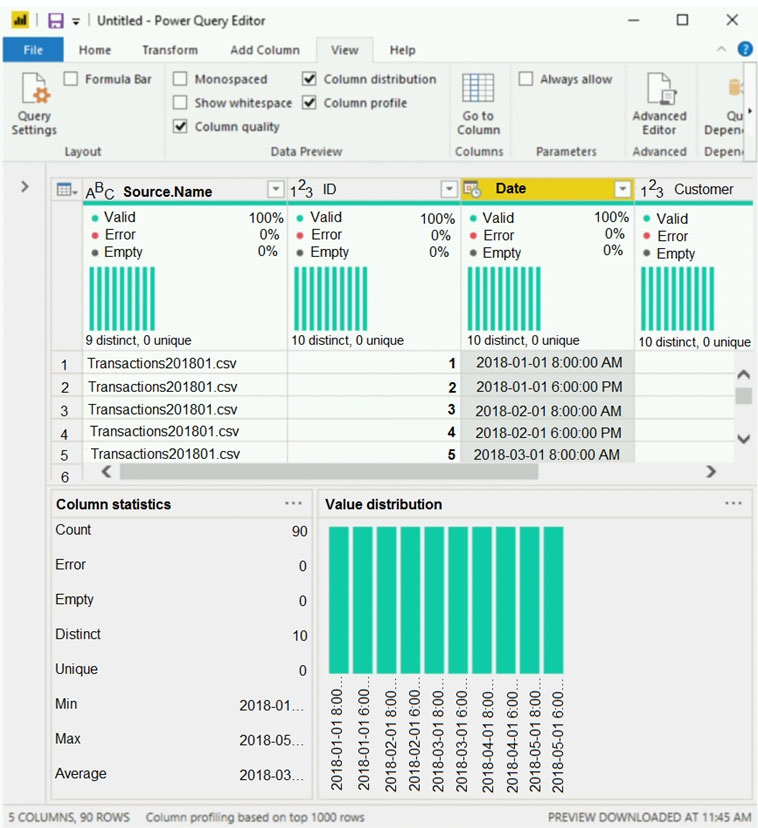
The query gets CSV files from a folder.
Use the drop-down menus to select the answer choice that completes each statement based on the information presented in the graphic.
NOTE: Each correct selection is worth one point.
Hot Area:
DRAG DROP -
You have the line chart shown in the exhibit. (Click the Exhibit tab.)
You need to modify the chart to meet the following requirements:
✑ Identify months that have order counts above the mean.
✑ Display the mean monthly order count.
Which three actions should you perform in sequence? To answer, move the appropriate actions from the list of actions to the answer area and arrange them in the correct order.
Select and Place: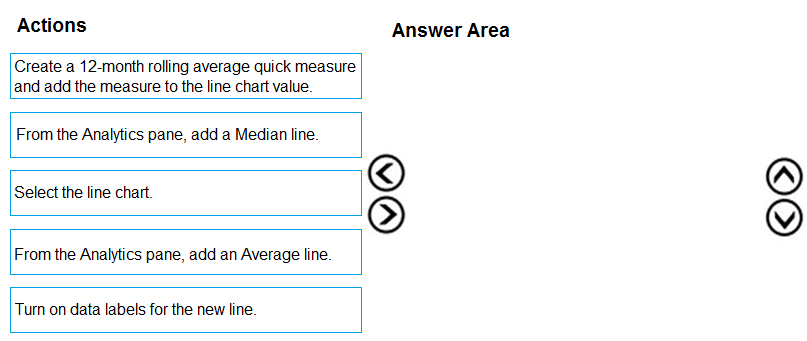
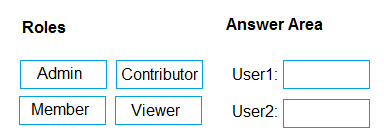
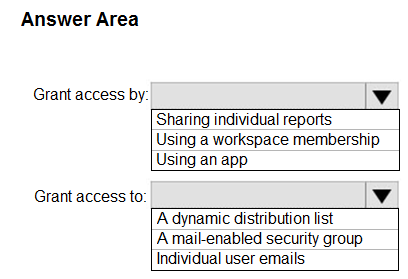
You have a Microsoft Power BI workspace.
You need to grant the user capabilities shown in the following table.
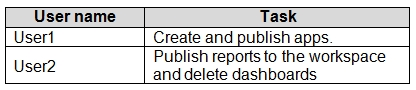
The solution must use the principle of least privilege.
Which user role should you assign to each user? To answer, drag the appropriate roles to the correct users. Each role may be used once, more than once, or not at all. You may need to drag the split bar between panes or scroll to view content.
NOTE: Each correct selection is worth one point.
Select and Place:
This is a case study. Case studies are not timed separately. You can use as much exam time as you would like to complete each case. However, there may be additional case studies and sections on this exam. You must manage your time to ensure that you are able to complete all question included on this exam in the time provided.
To answer the questions included in a case study, you will need to reference information that is provided in the case study. Case studies might contain exhibits and other resources that provide more information about the scenario that is described in the case study. Each question is independent of the other question on this case study.
At the end of this case study, a review screen will appear. This screen allows you to review your answers and to make changes before you move to the next section of the exam. After you begin a new section, you cannot return to this section.
To start the case study -
To display the first question on this case study, click the Next button. Use the buttons in the left pane to explore the content of the case study before you answer the questions. Clicking these buttons displays information such as business requirements, existing environment, and problem statements. If the case study has an All Information tab, note that the information displayed is identical to the information displayed on the subsequent tabs. When you are ready to answer a question, click the Question button to return to the question.
Overview -
Litware, Inc. Is an online retailer that uses Microsoft Power BI dashboards and reports.
The company plans to leverage data from Microsoft SQL Server databases, Microsoft Excel files, text files, and several other data sources.
Litware uses Azure Active Directory (Azure AD) to authenticate users.
Existing Environment -
Sales Data -
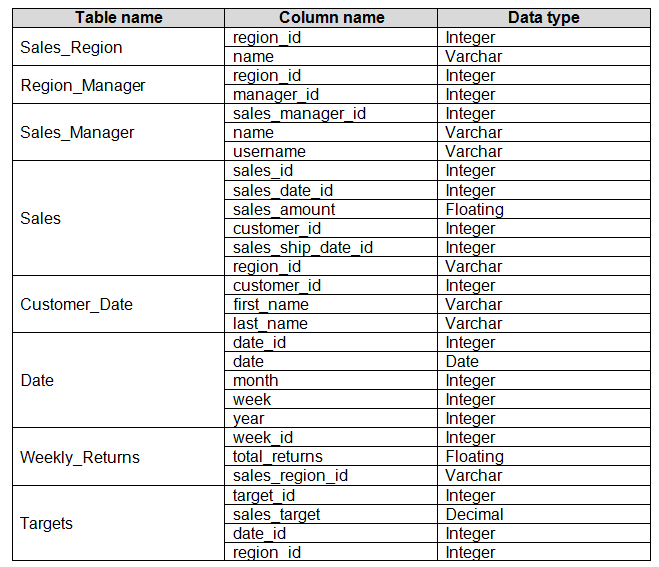
Litware has online sales data that has the SQL schema shown in the following table.

In the Date table, the date_id column has a format of yyyymmdd and the month column has a format of yyyymm.
The week column in the Date table and the week_id column in the Weekly_Returns table have a format of yyyyww.
The region_id column can be managed by only one sales manager.
Sales Data -
Litware, Inc. Is an online retailer that uses Microsoft Power BI dashboards and reports.
The company plans to leverage data from Microsoft SQL Server databases, Microsoft Excel files, text files, and several other data sources.
Litware uses Azure Active Directory (Azure AD) to authenticate users.
Data Concerns -
You are concerned with the quality and completeness of the sales data. You plan to verify the sales data for negative sales amounts.
Reporting Requirements -
Litware identifies the following technical requirements:
Executives require a visual that shows sales by region.
Region managers require a visual to analyze weekly sales and returns.
Sales managers must be able to see the sales data of their respective region only.
The sales managers require a visual to analyze sales performance versus sales targets.
The sale department requires reports that contain the number of sales transactions.
Users must be able to see the month in reports as shown in the following example: Feb 2020.
The customer service department requires a visual that can be filtered by both sales month and ship month independently.QuestionYou need to create a calculated column to display the month based on the reporting requirements.
Which DAX expression should you use?
This is a case study. Case studies are not timed separately. You can use as much exam time as you would like to complete each case. However, there may be additional case studies and sections on this exam. You must manage your time to ensure that you are able to complete all questions included on this exam in the time provided.
To answer the questions included in a case study, you will need to reference information that is provided in the case study. Case studies might contain exhibits and other resources that provide more information about the scenario that is described in the case study. Each question is independent of the other question on this case study.
At the end of this case study, a review screen will appear. This screen allows you to review your answers and to make changes before you move to the next section of the exam. After you begin a new section, you cannot return to this section.
To start the case study -
To display the first question on this case study, click the Next button. Use the buttons in the left pane to explore the content of the case study before you answer the questions. Clicking these buttons displays information such as business requirements, existing environment, and problem statements. If the case study has an All Information tab, note that the information displayed is identical to the information displayed on the subsequent tabs. When you are ready to answer a question, click the Question button to return to the question.
Overview -
Existing Environment -
Contoso, Ltd. Is a manufacturing company that produces outdoor equipment. Contoso has quarterly board meetings for which financial analysts manually prepare
Microsoft Excel reports, including profit and loss statements for each of the company's four business units, a company balance sheet, and net income projections for the next quarter.
Data and Sources -
Data for the reports comes from three sources. Detailed revenue, cost, and expense data comes from an Azure SQL database. Summary balance sheet data comes from Microsoft Dynamics 365 Business Central. The balance sheet data is not related to the profit and loss results, other than they both relate dates.
Monthly revenue and expense projections for the next quarter come from a Microsoft SharePoint Online list. Quarterly projections relate to the profit and loss results by using the following shared dimensions: date, business unit, department, and product category.
Net Income Projection Data -
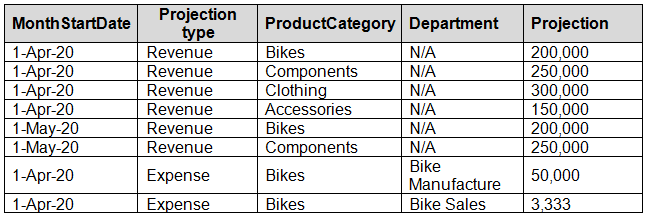
Net income projection data is stored in a SharePoint Online list named Projections in the format shown in the following table.

Revenue projections are set at the monthly level and summed to show projections for the quarter.
Balance Sheet Data -
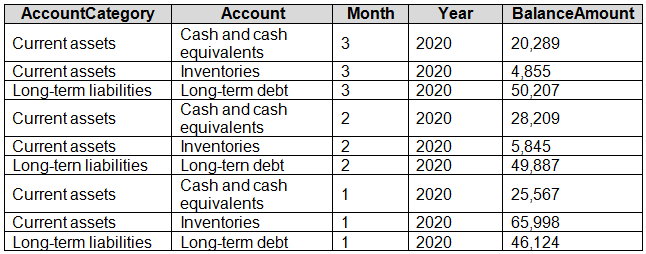
The balance sheet data is imported with final balances for each account per month in the format shown in the following table.

There is always a row for each account for each month in the balance sheet data.
Dynamics 365 Business Central Data
Business Central contains a product catalog that shows how products roll up to product categories, which roll up to business units.
Revenue data is provided at the date and product level. Expense data is provided at the date and department level.
Business Issues -
Historically, it has taken two analysts a week to prepare the reports for the quarterly board meetings. Also, there is usually at least one issue each quarter where a value in a report is wrong because of a bad cell reference in an Excel formula. On occasion, there are conflicting results in the reports because the products and departments that roll up to each business unit are not defined consistently.
Requirements -
Planned Changes -
Contoso plans to automate and standardize the quarterly reporting process by using Microsoft Power BI. The company wants to how long it takes to populate reports to less than two days. The company wants to create common logic for business units, products, and departments to be used across all reports, including, but not limited, to the quarterly reporting for the board.
Technical Requirements -
Contoso wants the reports and datasets refreshed with minimal manual effort.
The company wants to provide a single package of reports to the board that contains custom navigation and links to supplementary information.
Maintenance, including manually updating data and access, must be minimized as much as possible.
Security Requirements -
The reports must be made available to the board from powerbi.com. A mail-enabled security group will be used to share information with the board.
The analysts responsible for each business unit must see all the data the board sees, except the profit and loss data, which must be restricted to only their business unit's data. The analysts must be able to build new reports from the dataset that contains the profit and loss data, but any reports that the analysts build must not be included in the quarterly reports for the board. The analysts must not be able to share the quarterly reports with anyone.
Report Requirements -
You plan to relate the balance sheet to a standard date table in Power BI in a many-to-one relationship based on the last day of the month. At least one of the balance sheet reports in the quarterly reporting package must show the ending balances for the quarter, as well as for the previous quarter.
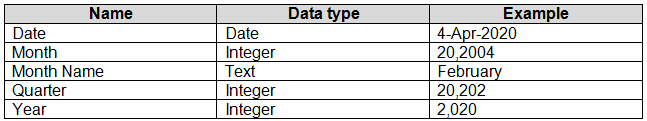
Projections must contain a column named RevenueProjection that contains the revenue projection amounts. A relationship must be created from Projections to a table named Date that contains the columns shown in the following table.

The relationships between products and departments to business units must be consistent across all reports.
The board must be able to get the following information from the quarterly reports:
Revenue trends over time
Ending balances for each account
A comparison of expenses versus projections by quarter
Changes in long-term liabilities from the previous quarter
A comparison of quarterly revenue versus the same quarter during the prior yearQuestionWhat is the minimum number of datasets and storage modes required to support the reports?
This is a case study. Case studies are not timed separately. You can use as much exam time as you would like to complete each case. However, there may be additional case studies and sections on this exam. You must manage your time to ensure that you are able to complete all questions included on this exam in the time provided.
To answer the questions included in a case study, you will need to reference information that is provided in the case study. Case studies might contain exhibits and other resources that provide more information about the scenario that is described in the case study. Each question is independent of the other question on this case study.
At the end of this case study, a review screen will appear. This screen allows you to review your answers and to make changes before you move to the next section of the exam. After you begin a new section, you cannot return to this section.
To start the case study -
To display the first question on this case study, click the Next button. Use the buttons in the left pane to explore the content of the case study before you answer the questions. Clicking these buttons displays information such as business requirements, existing environment, and problem statements. If the case study has an All Information tab, note that the information displayed is identical to the information displayed on the subsequent tabs. When you are ready to answer a question, click the Question button to return to the question.
Overview -
Litware, Inc. Is an online retailer that uses Microsoft Power BI dashboards and reports.
The company plans to leverage data from Microsoft SQL Server databases, Microsoft Excel files, text files, and several other data sources.
Litware uses Azure Active Directory (Azure AD) to authenticate users.
Existing Environment -
Sales Data -
Litware has online sales data that has the SQL schema shown in the following table.

In the Date table, the date_id column has a format of yyyymmdd and the month column has a format of yyyymm.
The week column in the Date table and the week_id column in the Weekly_Returns table have a format of yyyyww.
The region_id column can be managed by only one sales manager.
Sales Data -
Litware, Inc. Is an online retailer that uses Microsoft Power BI dashboards and reports.
The company plans to leverage data from Microsoft SQL Server databases, Microsoft Excel files, text files, and several other data sources.
Litware uses Azure Active Directory (Azure AD) to authenticate users.
Data Concerns -
You are concerned with the quality and completeness of the sales data. You plan to verify the sales data for negative sales amounts.
Reporting Requirements -
Litware identifies the following technical requirements:
Executives require a visual that shows sales by region.
Region managers require a visual to analyze weekly sales and returns.
Sales managers must be able to see the sales data of their respective region only.
The sales managers require a visual to analyze sales performance versus sales targets.
The sale department requires reports that contain the number of sales transactions.
Users must be able to see the month in reports as shown in the following example: Feb 2020.
The customer service department requires a visual that can be filtered by both sales month and ship month independently.QuestionYou need to provide a solution to provide the sales managers with the required access.
What should you include in the solution?
This is a case study. Case studies are not timed separately. You can use as much exam time as you would like to complete each case. However, there may be additional case studies and sections on this exam. You must manage your time to ensure that you are able to complete all questions included on this exam in the time provided.
To answer the questions included in a case study, you will need to reference information that is provided in the case study. Case studies might contain exhibits and other resources that provide more information about the scenario that is described in the case study. Each question is independent of the other question on this case study.
At the end of this case study, a review screen will appear. This screen allows you to review your answers and to make changes before you move to the next section of the exam. After you begin a new section, you cannot return to this section.
To start the case study -
To display the first question on this case study, click the Next button. Use the buttons in the left pane to explore the content of the case study before you answer the questions. Clicking these buttons displays information such as business requirements, existing environment, and problem statements. If the case study has an All Information tab, note that the information displayed is identical to the information displayed on the subsequent tabs. When you are ready to answer a question, click the Question button to return to the question.
Overview -
Litware, Inc. Is an online retailer that uses Microsoft Power BI dashboards and reports.
The company plans to leverage data from Microsoft SQL Server databases, Microsoft Excel files, text files, and several other data sources.
Litware uses Azure Active Directory (Azure AD) to authenticate users.
Existing Environment -
Sales Data -
Litware has online sales data that has the SQL schema shown in the following table.
In the Date table, the date_id column has a format of yyyymmdd and the month column has a format of yyyymm.
The week column in the Date table and the week_id column in the Weekly_Returns table have a format of yyyyww.
The region_id column can be managed by only one sales manager.
Sales Data -
Litware, Inc. Is an online retailer that uses Microsoft Power BI dashboards and reports.
The company plans to leverage data from Microsoft SQL Server databases, Microsoft Excel files, text files, and several other data sources.
Litware uses Azure Active Directory (Azure AD) to authenticate users.
Data Concerns -
You are concerned with the quality and completeness of the sales data. You plan to verify the sales data for negative sales amounts.
Reporting Requirements -
Litware identifies the following technical requirements:
Executives require a visual that shows sales by region.
Region managers require a visual to analyze weekly sales and returns.
Sales managers must be able to see the sales data of their respective region only.
The sales managers require a visual to analyze sales performance versus sales targets.
The sale department requires reports that contain the number of sales transactions.
Users must be able to see the month in reports as shown in the following example: Feb 2020.
The customer service department requires a visual that can be filtered by both sales month and ship month independently.QuestionYou need to create a relationship between the Weekly_Returns table and the Date table to meet the reporting requirements of the regional managers.
What should you do?
This is a case study. Case studies are not timed separately. You can use as much exam time as you would like to complete each case. However, there may be additional case studies and sections on this exam. You must manage your time to ensure that you are able to complete all questions included on this exam in the time provided.
To answer the questions included in a case study, you will need to reference information that is provided in the case study. Case studies might contain exhibits and other resources that provide more information about the scenario that is described in the case study. Each question is independent of the other question on this case study.
At the end of this case study, a review screen will appear. This screen allows you to review your answers and to make changes before you move to the next section of the exam. After you begin a new section, you cannot return to this section.
To start the case study -
To display the first question on this case study, click the Next button. Use the buttons in the left pane to explore the content of the case study before you answer the questions. Clicking these buttons displays information such as business requirements, existing environment, and problem statements. If the case study has an All Information tab, note that the information displayed is identical to the information displayed on the subsequent tabs. When you are ready to answer a question, click the Question button to return to the question.
Overview -
Litware, Inc. Is an online retailer that uses Microsoft Power BI dashboards and reports.
The company plans to leverage data from Microsoft SQL Server databases, Microsoft Excel files, text files, and several other data sources.
Litware uses Azure Active Directory (Azure AD) to authenticate users.
Existing Environment -
Sales Data -
Litware has online sales data that has the SQL schema shown in the following table.
In the Date table, the date_id column has a format of yyyymmdd and the month column has a format of yyyymm.
The week column in the Date table and the week_id column in the Weekly_Returns table have a format of yyyyww.
The region_id column can be managed by only one sales manager.
Sales Data -
Litware, Inc. Is an online retailer that uses Microsoft Power BI dashboards and reports.
The company plans to leverage data from Microsoft SQL Server databases, Microsoft Excel files, text files, and several other data sources.
Litware uses Azure Active Directory (Azure AD) to authenticate users.
Data Concerns -
You are concerned with the quality and completeness of the sales data. You plan to verify the sales data for negative sales amounts.
Reporting Requirements -
Litware identifies the following technical requirements:
Executives require a visual that shows sales by region.
Region managers require a visual to analyze weekly sales and returns.
Sales managers must be able to see the sales data of their respective region only.
The sales managers require a visual to analyze sales performance versus sales targets.
The sale department requires reports that contain the number of sales transactions.
Users must be able to see the month in reports as shown in the following example: Feb 2020.
The customer service department requires a visual that can be filtered by both sales month and ship month independently.QuestionYou need to create relationships to meet the reporting requirements of the customer service department.
What should you create?
This is a case study. Case studies are not timed separately. You can use as much exam time as you would like to complete each case. However, there may be additional case studies and sections on this exam. You must manage your time to ensure that you are able to complete all questions included on this exam in the time provided.
To answer the questions included in a case study, you will need to reference information that is provided in the case study. Case studies might contain exhibits and other resources that provide more information about the scenario that is described in the case study. Each question is independent of the other question on this case study.
At the end of this case study, a review screen will appear. This screen allows you to review your answers and to make changes before you move to the next section of the exam. After you begin a new section, you cannot return to this section.
To start the case study -
To display the first question on this case study, click the Next button. Use the buttons in the left pane to explore the content of the case study before you answer the questions. Clicking these buttons displays information such as business requirements, existing environment, and problem statements. If the case study has an All Information tab, note that the information displayed is identical to the information displayed on the subsequent tabs. When you are ready to answer a question, click the Question button to return to the question.
Overview -
Existing Environment -
Contoso, Ltd. Is a manufacturing company that produces outdoor equipment. Contoso has quarterly board meetings for which financial analysts manually prepare
Microsoft Excel reports, including profit and loss statements for each of the company's four business units, a company balance sheet, and net income projections for the next quarter.
Data and Sources -
Data for the reports comes from three sources. Detailed revenue, cost, and expense data comes from an Azure SQL database. Summary balance sheet data comes from Microsoft Dynamics 365 Business Central. The balance sheet data is not related to the profit and loss results, other than they both relate dates.
Monthly revenue and expense projections for the next quarter come from a Microsoft SharePoint Online list. Quarterly projections relate to the profit and loss results by using the following shared dimensions: date, business unit, department, and product category.
Net Income Projection Data -
Net income projection data is stored in a SharePoint Online list named Projections in the format shown in the following table.

Revenue projections are set at the monthly level and summed to show projections for the quarter.
Balance Sheet Data -
The balance sheet data is imported with final balances for each account per month in the format shown in the following table.

There is always a row for each account for each month in the balance sheet data.
Dynamics 365 Business Central Data
Business Central contains a product catalog that shows how products roll up to product categories, which roll up to business units.
Revenue data is provided at the date and product level. Expense data is provided at the date and department level.
Business Issues -
Historically, it has taken two analysts a week to prepare the reports for the quarterly board meetings. Also, there is usually at least one issue each quarter where a value in a report is wrong because of a bad cell reference in an Excel formula. On occasion, there are conflicting results in the reports because the products and departments that roll up to each business unit are not defined consistently.
Requirements -
Planned Changes -
Contoso plans to automate and standardize the quarterly reporting process by using Microsoft Power BI. The company wants to how long it takes to populate reports to less than two days. The company wants to create common logic for business units, products, and departments to be used across all reports, including, but not limited, to the quarterly reporting for the board.
Technical Requirements -
Contoso wants the reports and datasets refreshed with minimal manual effort.
The company wants to provide a single package of reports to the board that contains custom navigation and links to supplementary information.
Maintenance, including manually updating data and access, must be minimized as much as possible.
Security Requirements -
The reports must be made available to the board from powerbi.com. A mail-enabled security group will be used to share information with the board.
The analysts responsible for each business unit must see all the data the board sees, except the profit and loss data, which must be restricted to only their business unit's data. The analysts must be able to build new reports from the dataset that contains the profit and loss data, but any reports that the analysts build must not be included in the quarterly reports for the board. The analysts must not be able to share the quarterly reports with anyone.
Report Requirements -
You plan to relate the balance sheet to a standard date table in Power BI in a many-to-one relationship based on the last day of the month. At least one of the balance sheet reports in the quarterly reporting package must show the ending balances for the quarter, as well as for the previous quarter.
Projections must contain a column named RevenueProjection that contains the revenue projection amounts. A relationship must be created from Projections to a table named Date that contains the columns shown in the following table.

The relationships between products and departments to business units must be consistent across all reports.
The board must be able to get the following information from the quarterly reports:
Revenue trends over time
Ending balances for each account
A comparison of expenses versus projections by quarter
Changes in long-term liabilities from the previous quarter
A comparison of quarterly revenue versus the same quarter during the prior yearQuestionWhich DAX expression should you use to get the ending balances in the balance sheet reports?
This is a case study. Case studies are not timed separately. You can use as much exam time as you would like to complete each case. However, there may be additional case studies and sections on this exam. You must manage your time to ensure that you are able to complete all questions included on this exam in the time provided.
To answer the questions included in a case study, you will need to reference information that is provided in the case study. Case studies might contain exhibits and other resources that provide more information about the scenario that is described in the case study. Each question is independent of the other question on this case study.
At the end of this case study, a review screen will appear. This screen allows you to review your answers and to make changes before you move to the next section of the exam. After you begin a new section, you cannot return to this section.
To start the case study -
To display the first question on this case study, click the Next button. Use the buttons in the left pane to explore the content of the case study before you answer the questions. Clicking these buttons displays information such as business requirements, existing environment, and problem statements. If the case study has an All Information tab, note that the information displayed is identical to the information displayed on the subsequent tabs. When you are ready to answer a question, click the Question button to return to the question.
Overview -
Existing Environment -
Contoso, Ltd. Is a manufacturing company that produces outdoor equipment. Contoso has quarterly board meetings for which financial analysts manually prepare
Microsoft Excel reports, including profit and loss statements for each of the company's four business units, a company balance sheet, and net income projections for the next quarter.
Data and Sources -
Data for the reports comes from three sources. Detailed revenue, cost, and expense data comes from an Azure SQL database. Summary balance sheet data comes from Microsoft Dynamics 365 Business Central. The balance sheet data is not related to the profit and loss results, other than they both relate dates.
Monthly revenue and expense projections for the next quarter come from a Microsoft SharePoint Online list. Quarterly projections relate to the profit and loss results by using the following shared dimensions: date, business unit, department, and product category.
Net Income Projection Data -
Net income projection data is stored in a SharePoint Online list named Projections in the format shown in the following table.
Revenue projections are set at the monthly level and summed to show projections for the quarter.
Balance Sheet Data -
The balance sheet data is imported with final balances for each account per month in the format shown in the following table.
There is always a row for each account for each month in the balance sheet data.
Dynamics 365 Business Central Data
Business Central contains a product catalog that shows how products roll up to product categories, which roll up to business units.
Revenue data is provided at the date and product level. Expense data is provided at the date and department level.
Business Issues -
Historically, it has taken two analysts a week to prepare the reports for the quarterly board meetings. Also, there is usually at least one issue each quarter where a value in a report is wrong because of a bad cell reference in an Excel formula. On occasion, there are conflicting results in the reports because the products and departments that roll up to each business unit are not defined consistently.
Requirements -
Planned Changes -
Contoso plans to automate and standardize the quarterly reporting process by using Microsoft Power BI. The company wants to how long it takes to populate reports to less than two days. The company wants to create common logic for business units, products, and departments to be used across all reports, including, but not limited, to the quarterly reporting for the board.
Technical Requirements -
Contoso wants the reports and datasets refreshed with minimal manual effort.
The company wants to provide a single package of reports to the board that contains custom navigation and links to supplementary information.
Maintenance, including manually updating data and access, must be minimized as much as possible.
Security Requirements -
The reports must be made available to the board from powerbi.com. A mail-enabled security group will be used to share information with the board.
The analysts responsible for each business unit must see all the data the board sees, except the profit and loss data, which must be restricted to only their business unit's data. The analysts must be able to build new reports from the dataset that contains the profit and loss data, but any reports that the analysts build must not be included in the quarterly reports for the board. The analysts must not be able to share the quarterly reports with anyone.
Report Requirements -
You plan to relate the balance sheet to a standard date table in Power BI in a many-to-one relationship based on the last day of the month. At least one of the balance sheet reports in the quarterly reporting package must show the ending balances for the quarter, as well as for the previous quarter.
Projections must contain a column named RevenueProjection that contains the revenue projection amounts. A relationship must be created from Projections to a table named Date that contains the columns shown in the following table.
The relationships between products and departments to business units must be consistent across all reports.
The board must be able to get the following information from the quarterly reports:
Revenue trends over time
Ending balances for each account
A comparison of expenses versus projections by quarter
Changes in long-term liabilities from the previous quarter
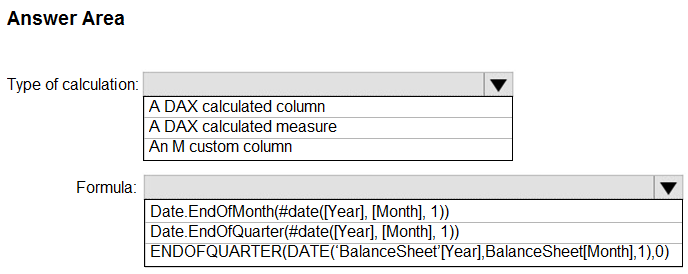
A comparison of quarterly revenue versus the same quarter during the prior yearQuestionHOTSPOT -
You need to calculate the last day of the month in the balance sheet data to ensure that you can relate the balance sheet data to the Date table.
Which type of calculation and which formula should you use? To answer, select the appropriate options in the answer area.
NOTE: Each correct selection is worth one point.
Hot Area:
This is a case study. Case studies are not timed separately. You can use as much exam time as you would like to complete each case. However, there may be additional case studies and sections on this exam. You must manage your time to ensure that you are able to complete all questions included on this exam in the time provided.
To answer the questions included in a case study, you will need to reference information that is provided in the case study. Case studies might contain exhibits and other resources that provide more information about the scenario that is described in the case study. Each question is independent of the other question on this case study.
At the end of this case study, a review screen will appear. This screen allows you to review your answers and to make changes before you move to the next section of the exam. After you begin a new section, you cannot return to this section.
To start the case study -
To display the first question on this case study, click the Next button. Use the buttons in the left pane to explore the content of the case study before you answer the questions. Clicking these buttons displays information such as business requirements, existing environment, and problem statements. If the case study has an All Information tab, note that the information displayed is identical to the information displayed on the subsequent tabs. When you are ready to answer a question, click the Question button to return to the question.
Overview -
Litware, Inc. Is an online retailer that uses Microsoft Power BI dashboards and reports.
The company plans to leverage data from Microsoft SQL Server databases, Microsoft Excel files, text files, and several other data sources.
Litware uses Azure Active Directory (Azure AD) to authenticate users.
Existing Environment -
Sales Data -
Litware has online sales data that has the SQL schema shown in the following table.

In the Date table, the date_id column has a format of yyyymmdd and the month column has a format of yyyymm.
The week column in the Date table and the week_id column in the Weekly_Returns table have a format of yyyyww.
The region_id column can be managed by only one sales manager.
Sales Data -
Litware, Inc. Is an online retailer that uses Microsoft Power BI dashboards and reports.
The company plans to leverage data from Microsoft SQL Server databases, Microsoft Excel files, text files, and several other data sources.
Litware uses Azure Active Directory (Azure AD) to authenticate users.
Data Concerns -
You are concerned with the quality and completeness of the sales data. You plan to verify the sales data for negative sales amounts.
Reporting Requirements -
Litware identifies the following technical requirements:
Executives require a visual that shows sales by region.
Region managers require a visual to analyze weekly sales and returns.
Sales managers must be able to see the sales data of their respective region only.
The sales managers require a visual to analyze sales performance versus sales targets.
The sale department requires reports that contain the number of sales transactions.
Users must be able to see the month in reports as shown in the following example: Feb 2020.
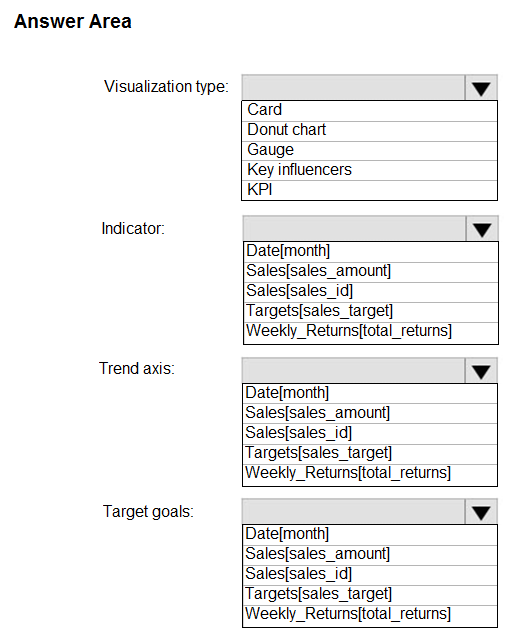
The customer service department requires a visual that can be filtered by both sales month and ship month independently.QuestionHOTSPOT -
You need to create a visualization to meet the reporting requirements of the sales managers.
How should you create the visualization? To answer, select the appropriate options in the answer area.
NOTE: Each correct selection is worth one point.
Hot Area:
This is a case study. Case studies are not timed separately. You can use as much exam time as you would like to complete each case. However, there may be additional case studies and sections on this exam. You must manage your time to ensure that you are able to complete all questions included on this exam in the time provided.
To answer the questions included in a case study, you will need to reference information that is provided in the case study. Case studies might contain exhibits and other resources that provide more information about the scenario that is described in the case study. Each question is independent of the other question on this case study.
At the end of this case study, a review screen will appear. This screen allows you to review your answers and to make changes before you move to the next section of the exam. After you begin a new section, you cannot return to this section.
To start the case study -
To display the first question on this case study, click the Next button. Use the buttons in the left pane to explore the content of the case study before you answer the questions. Clicking these buttons displays information such as business requirements, existing environment, and problem statements. If the case study has an All Information tab, note that the information displayed is identical to the information displayed on the subsequent tabs. When you are ready to answer a question, click the Question button to return to the question.
Overview -
Existing Environment -
Contoso, Ltd. Is a manufacturing company that produces outdoor equipment. Contoso has quarterly board meetings for which financial analysts manually prepare
Microsoft Excel reports, including profit and loss statements for each of the company's four business units, a company balance sheet, and net income projections for the next quarter.
Data and Sources -
Data for the reports comes from three sources. Detailed revenue, cost, and expense data comes from an Azure SQL database. Summary balance sheet data comes from Microsoft Dynamics 365 Business Central. The balance sheet data is not related to the profit and loss results, other than they both relate dates.
Monthly revenue and expense projections for the next quarter come from a Microsoft SharePoint Online list. Quarterly projections relate to the profit and loss results by using the following shared dimensions: date, business unit, department, and product category.
Net Income Projection Data -
Net income projection data is stored in a SharePoint Online list named Projections in the format shown in the following table.
Revenue projections are set at the monthly level and summed to show projections for the quarter.
Balance Sheet Data -
The balance sheet data is imported with final balances for each account per month in the format shown in the following table.

There is always a row for each account for each month in the balance sheet data.
Dynamics 365 Business Central Data
Business Central contains a product catalog that shows how products roll up to product categories, which roll up to business units.
Revenue data is provided at the date and product level. Expense data is provided at the date and department level.
Business Issues -
Historically, it has taken two analysts a week to prepare the reports for the quarterly board meetings. Also, there is usually at least one issue each quarter where a value in a report is wrong because of a bad cell reference in an Excel formula. On occasion, there are conflicting results in the reports because the products and departments that roll up to each business unit are not defined consistently.
Requirements -
Planned Changes -
Contoso plans to automate and standardize the quarterly reporting process by using Microsoft Power BI. The company wants to how long it takes to populate reports to less than two days. The company wants to create common logic for business units, products, and departments to be used across all reports, including, but not limited, to the quarterly reporting for the board.
Technical Requirements -
Contoso wants the reports and datasets refreshed with minimal manual effort.
The company wants to provide a single package of reports to the board that contains custom navigation and links to supplementary information.
Maintenance, including manually updating data and access, must be minimized as much as possible.
Security Requirements -
The reports must be made available to the board from powerbi.com. A mail-enabled security group will be used to share information with the board.
The analysts responsible for each business unit must see all the data the board sees, except the profit and loss data, which must be restricted to only their business unit's data. The analysts must be able to build new reports from the dataset that contains the profit and loss data, but any reports that the analysts build must not be included in the quarterly reports for the board. The analysts must not be able to share the quarterly reports with anyone.
Report Requirements -
You plan to relate the balance sheet to a standard date table in Power BI in a many-to-one relationship based on the last day of the month. At least one of the balance sheet reports in the quarterly reporting package must show the ending balances for the quarter, as well as for the previous quarter.
Projections must contain a column named RevenueProjection that contains the revenue projection amounts. A relationship must be created from Projections to a table named Date that contains the columns shown in the following table.

The relationships between products and departments to business units must be consistent across all reports.
The board must be able to get the following information from the quarterly reports:
Revenue trends over time
Ending balances for each account
A comparison of expenses versus projections by quarter
Changes in long-term liabilities from the previous quarter
A comparison of quarterly revenue versus the same quarter during the prior yearQuestionDRAG DROP -
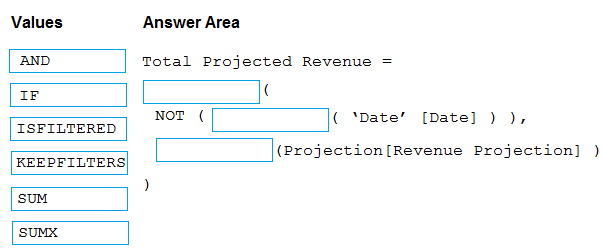
You need to create a DAX measure in the data model that only allows users to see projections at the appropriate level of granularity.
How should you complete the measure? To answer, drag the appropriate values to the correct targets. Each value may be used once, more than once, or not at all. You may need to drag the split bar between panes or scroll to view content.
NOTE: Each correct selection is worth one point.
Select and Place:
This is a case study. Case studies are not timed separately. You can use as much exam time as you would like to complete each case. However, there may be additional case studies and sections on this exam. You must manage your time to ensure that you are able to complete all questions included on this exam in the time provided.
To answer the questions included in a case study, you will need to reference information that is provided in the case study. Case studies might contain exhibits and other resources that provide more information about the scenario that is described in the case study. Each question is independent of the other question on this case study.
At the end of this case study, a review screen will appear. This screen allows you to review your answers and to make changes before you move to the next section of the exam. After you begin a new section, you cannot return to this section.
To start the case study -
To display the first question on this case study, click the Next button. Use the buttons in the left pane to explore the content of the case study before you answer the questions. Clicking these buttons displays information such as business requirements, existing environment, and problem statements. If the case study has an All Information tab, note that the information displayed is identical to the information displayed on the subsequent tabs. When you are ready to answer a question, click the Question button to return to the question.
Overview -
Existing Environment -
Contoso, Ltd. Is a manufacturing company that produces outdoor equipment. Contoso has quarterly board meetings for which financial analysts manually prepare
Microsoft Excel reports, including profit and loss statements for each of the company's four business units, a company balance sheet, and net income projections for the next quarter.
Data and Sources -
Data for the reports comes from three sources. Detailed revenue, cost, and expense data comes from an Azure SQL database. Summary balance sheet data comes from Microsoft Dynamics 365 Business Central. The balance sheet data is not related to the profit and loss results, other than they both relate dates.
Monthly revenue and expense projections for the next quarter come from a Microsoft SharePoint Online list. Quarterly projections relate to the profit and loss results by using the following shared dimensions: date, business unit, department, and product category.
Net Income Projection Data -
Net income projection data is stored in a SharePoint Online list named Projections in the format shown in the following table.
Revenue projections are set at the monthly level and summed to show projections for the quarter.
Balance Sheet Data -
The balance sheet data is imported with final balances for each account per month in the format shown in the following table.
There is always a row for each account for each month in the balance sheet data.
Dynamics 365 Business Central Data
Business Central contains a product catalog that shows how products roll up to product categories, which roll up to business units.
Revenue data is provided at the date and product level. Expense data is provided at the date and department level.
Business Issues -
Historically, it has taken two analysts a week to prepare the reports for the quarterly board meetings. Also, there is usually at least one issue each quarter where a value in a report is wrong because of a bad cell reference in an Excel formula. On occasion, there are conflicting results in the reports because the products and departments that roll up to each business unit are not defined consistently.
Requirements -
Planned Changes -
Contoso plans to automate and standardize the quarterly reporting process by using Microsoft Power BI. The company wants to how long it takes to populate reports to less than two days. The company wants to create common logic for business units, products, and departments to be used across all reports, including, but not limited, to the quarterly reporting for the board.
Technical Requirements -
Contoso wants the reports and datasets refreshed with minimal manual effort.
The company wants to provide a single package of reports to the board that contains custom navigation and links to supplementary information.
Maintenance, including manually updating data and access, must be minimized as much as possible.
Security Requirements -
The reports must be made available to the board from powerbi.com. A mail-enabled security group will be used to share information with the board.
The analysts responsible for each business unit must see all the data the board sees, except the profit and loss data, which must be restricted to only their business unit's data. The analysts must be able to build new reports from the dataset that contains the profit and loss data, but any reports that the analysts build must not be included in the quarterly reports for the board. The analysts must not be able to share the quarterly reports with anyone.
Report Requirements -
You plan to relate the balance sheet to a standard date table in Power BI in a many-to-one relationship based on the last day of the month. At least one of the balance sheet reports in the quarterly reporting package must show the ending balances for the quarter, as well as for the previous quarter.
Projections must contain a column named RevenueProjection that contains the revenue projection amounts. A relationship must be created from Projections to a table named Date that contains the columns shown in the following table.
The relationships between products and departments to business units must be consistent across all reports.
The board must be able to get the following information from the quarterly reports:
Revenue trends over time
Ending balances for each account
A comparison of expenses versus projections by quarter
Changes in long-term liabilities from the previous quarter
A comparison of quarterly revenue versus the same quarter during the prior yearQuestionWhich two types of visualizations can be used in the balance sheet reports to meet the reporting goals? Each correct answer presents part of the solution.
NOTE: Each correct selection is worth one point.
This is a case study. Case studies are not timed separately. You can use as much exam time as you would like to complete each case. However, there may be additional case studies and sections on this exam. You must manage your time to ensure that you are able to complete all questions included on this exam in the time provided.
To answer the questions included in a case study, you will need to reference information that is provided in the case study. Case studies might contain exhibits and other resources that provide more information about the scenario that is described in the case study. Each question is independent of the other question on this case study.
At the end of this case study, a review screen will appear. This screen allows you to review your answers and to make changes before you move to the next section of the exam. After you begin a new section, you cannot return to this section.
To start the case study -
To display the first question on this case study, click the Next button. Use the buttons in the left pane to explore the content of the case study before you answer the questions. Clicking these buttons displays information such as business requirements, existing environment, and problem statements. If the case study has an All Information tab, note that the information displayed is identical to the information displayed on the subsequent tabs. When you are ready to answer a question, click the Question button to return to the question.
Overview -
Existing Environment -
Contoso, Ltd. Is a manufacturing company that produces outdoor equipment. Contoso has quarterly board meetings for which financial analysts manually prepare
Microsoft Excel reports, including profit and loss statements for each of the company's four business units, a company balance sheet, and net income projections for the next quarter.
Data and Sources -
Data for the reports comes from three sources. Detailed revenue, cost, and expense data comes from an Azure SQL database. Summary balance sheet data comes from Microsoft Dynamics 365 Business Central. The balance sheet data is not related to the profit and loss results, other than they both relate dates.
Monthly revenue and expense projections for the next quarter come from a Microsoft SharePoint Online list. Quarterly projections relate to the profit and loss results by using the following shared dimensions: date, business unit, department, and product category.
Net Income Projection Data -
Net income projection data is stored in a SharePoint Online list named Projections in the format shown in the following table.

Revenue projections are set at the monthly level and summed to show projections for the quarter.
Balance Sheet Data -
The balance sheet data is imported with final balances for each account per month in the format shown in the following table.
There is always a row for each account for each month in the balance sheet data.
Dynamics 365 Business Central Data
Business Central contains a product catalog that shows how products roll up to product categories, which roll up to business units.
Revenue data is provided at the date and product level. Expense data is provided at the date and department level.
Business Issues -
Historically, it has taken two analysts a week to prepare the reports for the quarterly board meetings. Also, there is usually at least one issue each quarter where a value in a report is wrong because of a bad cell reference in an Excel formula. On occasion, there are conflicting results in the reports because the products and departments that roll up to each business unit are not defined consistently.
Requirements -
Planned Changes -
Contoso plans to automate and standardize the quarterly reporting process by using Microsoft Power BI. The company wants to how long it takes to populate reports to less than two days. The company wants to create common logic for business units, products, and departments to be used across all reports, including, but not limited, to the quarterly reporting for the board.
Technical Requirements -
Contoso wants the reports and datasets refreshed with minimal manual effort.
The company wants to provide a single package of reports to the board that contains custom navigation and links to supplementary information.
Maintenance, including manually updating data and access, must be minimized as much as possible.
Security Requirements -
The reports must be made available to the board from powerbi.com. A mail-enabled security group will be used to share information with the board.
The analysts responsible for each business unit must see all the data the board sees, except the profit and loss data, which must be restricted to only their business unit's data. The analysts must be able to build new reports from the dataset that contains the profit and loss data, but any reports that the analysts build must not be included in the quarterly reports for the board. The analysts must not be able to share the quarterly reports with anyone.
Report Requirements -
You plan to relate the balance sheet to a standard date table in Power BI in a many-to-one relationship based on the last day of the month. At least one of the balance sheet reports in the quarterly reporting package must show the ending balances for the quarter, as well as for the previous quarter.
Projections must contain a column named RevenueProjection that contains the revenue projection amounts. A relationship must be created from Projections to a table named Date that contains the columns shown in the following table.
The relationships between products and departments to business units must be consistent across all reports.
The board must be able to get the following information from the quarterly reports:
Revenue trends over time
Ending balances for each account
A comparison of expenses versus projections by quarter
Changes in long-term liabilities from the previous quarter
A comparison of quarterly revenue versus the same quarter during the prior yearQuestionHOTSPOT -
How should you distribute the reports to the board? To answer, select the appropriate options in the answer area.
NOTE: Each correct selection is worth one point.
Hot Area:
This is a case study. Case studies are not timed separately. You can use as much exam time as you would like to complete each case. However, there may be additional case studies and sections on this exam. You must manage your time to ensure that you are able to complete all question included on this exam in the time provided.
To answer the questions included in a case study, you will need to reference information that is provided in the case study. Case studies might contain exhibits and other resources that provide more information about the scenario that is described in the case study. Each question is independent of the other question on this case study.
At the end of this case study, a review screen will appear. This screen allows you to review your answers and to make changes before you move to the next section of the exam. After you begin a new section, you cannot return to this section.
To start the case study -
To display the first question on this case study, click the Next button. Use the buttons in the left pane to explore the content of the case study before you answer the questions. Clicking these buttons displays information such as business requirements, existing environment, and problem statements. If the case study has an All Information tab, note that the information displayed is identical to the information displayed on the subsequent tabs. When you are ready to answer a question, click the Question button to return to the question.
Overview -
Litware, Inc. Is an online retailer that uses Microsoft Power BI dashboards and reports.
The company plans to leverage data from Microsoft SQL Server databases, Microsoft Excel files, text files, and several other data sources.
Litware uses Azure Active Directory (Azure AD) to authenticate users.
Existing Environment -
Sales Data -
Litware has online sales data that has the SQL schema shown in the following table.

In the Date table, the date_id column has a format of yyyymmdd and the month column has a format of yyyymm.
The week column in the Date table and the week_id column in the Weekly_Returns table have a format of yyyyww.
The sales_id column in the Sales table represents a unique transaction.
The region_id column can be managed by only one sales manager.
Data Concerns -
You are concerned with the quality and completeness of the sales data. You plan to verify the sales data for negative sales amounts.
Reporting Requirements -
Litware identifies the following technical requirements:
Executives require a visual that shows sales by region.
Regional managers require a visual to analyze weekly sales and returns.
Sales managers must be able to see the sales data of their respective region only.
The sales managers require a visual to analyze sales performance versus sales targets.
The sale department requires reports that contain the number of sales transactions.
Users must be able to see the month in reports as shown in the following example: Feb 2020.
The customer service department requires a visual that can be filtered by both sales month and ship month independently.QuestionYou need to review the data for which there are concerns before creating the data model.
What should you do in Power Query Editor?
This is a case study. Case studies are not timed separately. You can use as much exam time as you would like to complete each case. However, there may be additional case studies and sections on this exam. You must manage your time to ensure that you are able to complete all questions included on this exam in the time provided.
To answer the questions included in a case study, you will need to reference information that is provided in the case study. Case studies might contain exhibits and other resources that provide more information about the scenario that is described in the case study. Each question is independent of the other question on this case study.
At the end of this case study, a review screen will appear. This screen allows you to review your answers and to make changes before you move to the next section of the exam. After you begin a new section, you cannot return to this section.
To start the case study -
To display the first question on this case study, click the Next button. Use the buttons in the left pane to explore the content of the case study before you answer the questions. Clicking these buttons displays information such as business requirements, existing environment, and problem statements. If the case study has an All Information tab, note that the information displayed is identical to the information displayed on the subsequent tabs. When you are ready to answer a question, click the Question button to return to the question.
Overview -
Litware, Inc. Is an online retailer that uses Microsoft Power BI dashboards and reports.
The company plans to leverage data from Microsoft SQL Server databases, Microsoft Excel files, text files, and several other data sources.
Litware uses Azure Active Directory (Azure AD) to authenticate users.
Existing Environment -
Sales Data -
Litware has online sales data that has the SQL schema shown in the following table.
In the Date table, the date_id column has a format of yyyymmdd and the month column has a format of yyyymm.
The week column in the Date table and the week_id column in the Weekly_Returns table have a format of yyyyww.
The sales_id column in the Sales table represents a unique transaction.
The region_id column can be managed by only one sales manager.
Data Concerns -
You are concerned with the quality and completeness of the sales data. You plan to verify the sales data for negative sales amounts.
Reporting Requirements -
Litware identifies the following technical requirements:
Executives require a visual that shows sales by region.
Regional managers require a visual to analyze weekly sales and returns.
Sales managers must be able to see the sales data of their respective region only.
The sales managers require a visual to analyze sales performance versus sales targets.
The sale department requires reports that contain the number of sales transactions.
Users must be able to see the month in reports as shown in the following example: Feb 2020.
The customer service department requires a visual that can be filtered by both sales month and ship month independently.QuestionYou need to create relationships to meet the reporting requirements of the customer service department.
What should you create?
✑ First name
✑ Last name
✑ Email address
✑ State/Region
✑ Phone number
You import the list into Power Query Editor.
You need to ensure that the list contains records for each State/Region to which you want to target a marketing campaign.
Which two actions should you perform? Each correct answer presents part of the solution.
NOTE: Each correct selection is worth one point.
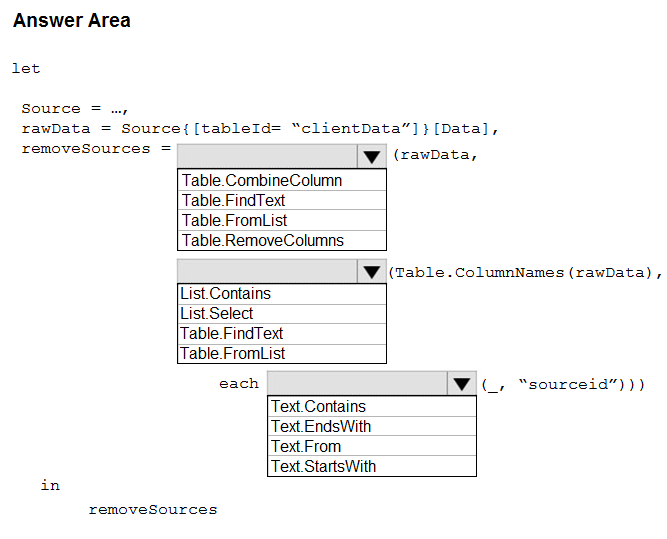
You have an API that returns more than 100 columns. The following is a sample of column names.
✑ client_notified_timestamp
✑ client_notified_source
✑ client_notified_sourceid
✑ client_notified_value
✑ client_responded_timestamp
✑ client_responded_source
✑ client_responded_sourceid
✑ client_responded_value
You plan to include only a subset of the returned columns.
You need to remove any columns that have a suffix of sourceid.
How should you complete the Power Query M code? To answer, select the appropriate options in the answer area.
NOTE: Each correct selection is worth one point.
Hot Area:
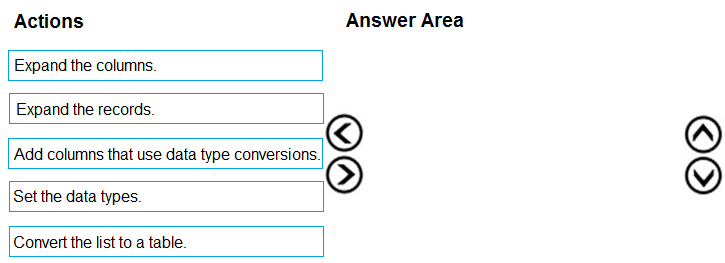
You are building a dataset from a JSON file that contains an array of documents.
You need to import attributes as columns from all the documents in the JSON file. The solution must ensure that date attributes can be used as date hierarchies in
Microsoft Power BI reports.
Which three actions should you perform in sequence? To answer, move the appropriate actions from the list of actions to the answer area and arrange them in the correct order.
Select and Place:
✑ Customer ID
✑ Customer Name
✑ Phone
✑ Email Address
✑ Address ID
Address contains the following columns:
✑ Address ID
✑ Address Line 1
✑ Address Line 2
✑ City
✑ State/Region
✑ Country
✑ Postal Code
The Customer ID and Address ID columns represent unique rows.
You need to create a query that has one row per customer. Each row must contain City, State/Region, and Country for each customer.
What should you do?
✑ Test
✑ Production
✑ Development
You have a dataset that uses the development database as a data source.
You need to configure the dataset so that you can easily change the data source between the development, test, and production database servers from powerbi.com.
Which should you do?