Chapter 3-4

Assess Your Economic Knowledge: Chapters 3-4 Quiz
Challenge yourself with our comprehensive quiz focused on essential economic concepts from Chapters 3 and 4. This quiz features 51 multiple-choice questions that cover demand and supply, market equilibrium, and related economic theories.
Key Features:
- 51 challenging questions
- Immediate feedback on answers
- Boost your knowledge of economic principles
1. If the demand for steak (a normal good) shifts to the left, the most likely reason is that:
A) the price of cattle feed has gone up
B) cattle production has declined.
C) consumer incomes have fallen.
D) the price of steak has risen.
2. He upward slope of the supply curve reflects the:
A) principle of specialization in production.
B) fact that price and quantity supplied are inversely related.
C) law of diminishing marginal utility.
D) law of supply.
3. Economists use the term "demand" to refer to:
A) a schedule of various combinations of market prices and amounts/quantities demanded.
B) a particular price-quantity combination on a stable demand curve.
C) an upsloping line on a graph that relates consumer purchases and product price.
D) the total amount spent on a particular commodity over a fixed time period.
4. A recent study found that an increase in the federal tax on beer (and thus an increase in the price of beer) would reduce the demand for marijuana. We can conclude that:
A) beer and marijuana are complementary goods.
B) beer is an inferior good.
C) beer and marijuana are substitute goods.
D) marijuana is an inferior good.
5.

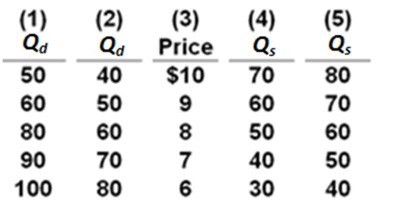
Refer to the table. Suppose that demand is represented by columns (3) and (2) and supply is represented by columns (3) and (5). If the price were artificially set at $9:
A) a surplus of 20 units would occur.
B)a shortage of 20 units would occur.
C) the market would clear.
D) demand would change from columns (3) and (2) to columns (3) and (1).
6. The relationship between quantity supplied and price is ________ and the relationship between quantity demanded and price is ________.
A) direct; inverse
B) inverse; inverse
C) inverse; direct
D) direct; direc
7. A leftward shift of a product supply curve might be caused by:
A) some firms leaving an industry.
B) a decline in the prices of needed inputs.
C) an improvement in the relevant technique of production.
D) an increase in consumer incomes.
8. There will be a surplus of a product when:
A) the supply curve is downward sloping and the demand curve is upward sloping.
B) consumers want to buy less than producers offer for sale.
C) the demand and supply curves fail to intersect.
D) price is below the equilibrium level.
9. A demand curve:
A) shows the relationship between income and spending.
B) indicates the quantity demanded at each price in a series of prices
C) graphs as an upsloping line.
D) shows the relationship between price and quantity supplied.
10. A shift to the right in the demand curve for product A can be most reasonably explained by saying that:
A) consumer preferences have changed in favor of A so that they now want to buy more at each possible price.
B) the price of A has declined and, as a result, consumers want to purchase more of it.
C) consumer incomes have declined, and consumers now want to buy less of A at each possible price.
D) the price of A has increased and, as a result, consumers want to purchase less of it.
11. An increase in product price will cause:
A) quantity supplied to decrease.
B) quantity demanded to increase.
C) the supply curve to shift to the left.
D) quantity demanded to decrease.
12. A government subsidy to the producers of a product:
A) increases product supply.
B) increases product demand.
C) reduces product demand.
D) reduces product supply.
13.

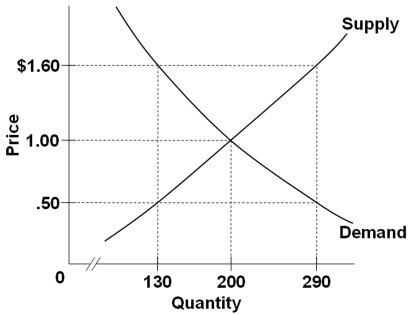
Refer to the diagram. A surplus of 160 units would be encountered if the price was:
A) $1.10, that is, $1.60 minus $.50
B) $0.50.
C) $1.00.
D) $1.60.
14.

Refer to the diagram. The equilibrium price and quantity in this market will be:
A) $0.50 and 130.
B) $1.60 and 290.
C) $1.00 and 200.
D) $1.60 and 130.
15.

Refer to the table. Suppose that demand is represented by columns (3) and (2) and supply is represented by columns (3) and (5). If the price were artificially set at $9:
A) a shortage of 20 units would occur.
B) a surplus of 20 units would occur.
C) the market would clear.
D) demand would change from columns (3) and (2) to columns (3) and (1).
16.
Answer the question on the basis of the given supply and demand data for wheat:

Refer to the data. Equilibrium price will be:
A) $3.
B) $1.
C) $4.
D) $2.
17.
Answer the question on the basis of the given supply and demand data for wheat:

Refer to the data. If the price in this market was $4:
A) the market would clear; quantity demanded would equal quantity supplied.
B) farmers would not be able to sell all their wheat.
C) there would be a shortage of wheat.
D) buyers would want to purchase more wheat than is currently being supplied.
18.
Answer the question on the basis of the given supply and demand data for wheat:

Refer to the data. If price was initially $4 and free to fluctuate, we would expect the:
A) quantity of wheat supplied to decline as a result of the subsequent price change.
B) quantity supplied to continue to exceed the quantity demanded.
C) quantity of wheat demanded to fall as a result of the subsequent price change.
D) price of wheat to rise.
19.

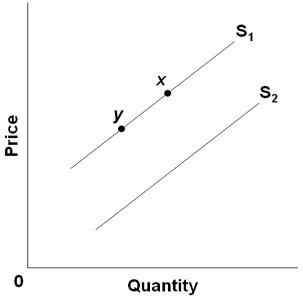
Refer to the diagram. An increase in quantity supplied is depicted by a:
A) shift from S1 to S2.
B) move from point x to point y.
C) shift from S2 to S1.
D) move from point y to point x
20.

Refer to the diagram. A decrease in supply is depicted by a:
A) move from point y to point x.
B) move from point x to point y.
C) shift from S1 to S2.
D) shift from S2 to S1.
21. There will be a surplus of a product when:
A) the demand and supply curves fail to intersect.
B) price is below the equilibrium level.
C) the supply curve is downward sloping and the demand curve is upward sloping.
D) consumers want to buy less than producers offer for sale.
22. The supply curve shows the relationship between:
A) total business revenues and quantity supplied.
B) price and quantity supplied.
C) physical inputs of resources and the resulting units of output.
D) production costs and the amount demanded.
23. Which of the following would most likely increase the demand for gasoline?
A) A widespread shift in car ownership from SUVs to hybrid sedans.
B) The expectation by consumers that gasoline prices will be lower in the future.
C) A decrease in the price of public transportation.
D) The expectation by consumers that gasoline prices will be higher in the future.
24. By an "increase in demand," economists mean that:
A) the quantity demanded at each price in a set of prices is smaller.
B) product price has fallen so consumers move down to a new point on the demand curve.
C) a leftward shift of the demand curve has occurred.
D) the quantity demanded at each price in a set of prices is greater.
25. At the equilibrium price:
A) quantity supplied may exceed quantity demanded or vice versa.
B) there are forces that cause price to rise.
C) there are forces that cause price to fall.
D) there are no pressures on price to either rise or fall.
26. The full-employment unemployment rate for the United States economy is now generally considered to be:
A) 5 to 6 percent of the labor force
B) 4 percent of the labor force
C) 2 percent of the labor force
D) 8 to 9 percent of the labor force
27. The total population of an economy is 175 million, the labor force is 125 million, and the number of employed workers is 117 million. The unemployment rate for this economy is:
A) 6.4 percent
B) 5.8 percent
C) 7.8 percent
D) 3.3 percent
28. Cross-country studies that bolster the "zero inflation" view indicate that lower rates of inflation are associated with:
A) High rates of unemployment
B) Higher rates of economic growth
C) Recessions
D) Lower rates of economic growth
29. The natural rate of unemployment:
A) Means that the economy will always realize its potential output
B) Is a fixed unemployment rate that does not change over time
C) Means that the economy will always operate at that rate
D) Is equal to the total of frictional and structural unemployment
30. F the Consumer Price Index was 90 in one year and 100 in the following year, then the rate of inflation is about:
A) 12 percent
B) 10 percent
C) 11 percent
D) 9 percent
31. The one quirk that labor markets have, which helps explain why unemployment goes up so much in a recession is that:
A) Firms are "demanders" of labor, rather than suppliers
B) Machines could "replace" humans in the labor market
C) A price floor called a "minimum wage law" exists for the labor market
D) Wages are flexible upward but "sticky" downward
32. In the 1920s, Germany after the First World War experienced an economic condition which can be best described as
A) Anticipated inflation
B) Unanticipated inflation
C) Cost-push inflation
D) Hyperinflation
33. Inflation is a rise in:
A) Unemployment over time
B) The general level of prices over time
C) Real GDP over time
D) The standard of living over time
34. If the unemployment rate for the United States economy rises from 7 to 11 percent during a year, we can conclude that:
A) The natural rate of unemployment for the United States economy has risen
B) The economy is experiencing only frictional unemployment
C) Actual GDP is less than potential GDP
D) Actual GDP exceeds potential GDP
35. If the total population is 200 million, the labor force is 100 million, and 92 million workers are employed, then the unemployment rate would be:
A) 8 percent
B) 10 percent
C) 6 percent
D) 4 percent
36. Which of the following statements is correct?
A) Structural unemployment is unemployment resulting from changes in the structure of consumer demand or technology
B) Frictional unemployment is the result of friction between labor and management over how best to perform work
C) Search unemployment is the broadest unemployment category because it covers all other types of unemployment
D) Cyclical unemployment is also called wait unemployment because this unemployment depends on the timing of the business cycle
37. The full-employment rate of unemployment is also called the:
A) Potential rate of unemployment
B) Cyclical rate of unemployment
C) Frictional rate of unemployment
D) Natural rate of unemployment
38. For a given amount of nominal income, the real income will:
A) Fall if the price level rises
B) Rise as the price level rises
C) Fall if the price level falls
D) Be unaffected if the price level falls
39. Assume that there is a fixed rate of interest on contracts for borrowers and lenders. If unanticipated inflation occurs in the economy, then:
A) Lenders are hurt, but borrowers benefit
B) Both lenders and borrowers are hurt
C) Both lenders and borrowers benefit
D) Borrowers are hurt, but lenders benefit
40. The CPI compiled by the Bureau of Labor Statistics is used in the computations for:
A) The inflation rate
B) The foreign exchange rate
C) The interest rate
D) The unemployment rate
41. When inflation occurs:
A) he purchasing power of money decreases
B) All prices are rising
C) Each dollar of income will buy more output than before
D) The purchasing power of money increases
42. F the Consumer Price Index was 125 in one year and 120 in the following year, then the rate of inflation is approximately:
A) -4.2 percent
B) 4.2 percent
C) -4.0 percent
D) 4.0 percent
43. A recession is defined as a situation where the average price level in the economy is increasing.
A) True
B) False
44. The total adult population of an economy is 175 million, the number of employed is 122 million, and the number of unemployed is 17 million. The percent of adults who are not in the labor force is:
A) 30.3 percent
B) 13.9 percent
C) 20.6 percent
D) 25.3 percent
45. New college graduates still looking for their first jobs would be classified as:
A) Cyclically unemployed
B) Not yet in the labor force
C) Part of structural unemployment
D) Frictionally unemployed
46.
The following items describe the responses of four individuals to a Bureau of Labor Statistics (BLS) survey of employment.
1. Mollie just graduated from college and is now looking for work. She has had three job interviews in the past month, but still has not gotten a job offer.
2. George used to work in an automotive assembly plant. He was laid off six months ago as the economy weakened. He expects to return to work in a few months when national economic conditions improve.
3. Jeanette worked as an aircraft design engineer for a company that produces military aircraft until she lost her job last year when the Federal government cut defense spending. She has been looking for similar work for a year but no company seems interested in her aircraft design skills.
4. Ricardo lost his job last year when his company downsized and laid off middle-level managers. He tried to find another job for a year, but was unsuccessful and quit looking for work.
Refer to the above information. Which individual is structurally unemployed?
A) Mollie
B) George
C) Jeanette
D) Ricardo
47. Which of the following measures the changes in the prices of a "market basket" of some 300 goods and services purchased by typical urban consumers?
A) The Wholesale Price Index
B) The GDP Price Index
C) The Consumer Price Index
D) The Retail Trade survey
48. A cumulative wage-price spiral which produces very rapid inflation is called:
A) Cost-push inflation
B) Hyperinflation
C) Anticipated inflation
D) Demand-pull inflation
49. Official unemployment rate statistics may:
A) Understate the amount of unemployment because of the presence of "discouraged" workers who are not actively seeking employment
B) Overstate the amount of unemployment by including part-time workers in the calculations
C) Understate the amount of unemployment by excluding part-time workers in the calculations
D) Overstate the amount of unemployment because of the presence of "discouraged" workers who are not actively seeking employment
50. The unemployed are those people who:
A) Do not have jobs
B) Are not employed but are seeking work
C) Are not in the workforce
D) Are not working
{"name":"Chapter 3-4", "url":"https://www.quiz-maker.com/QPREVIEW","txt":"Challenge yourself with our comprehensive quiz focused on essential economic concepts from Chapters 3 and 4. This quiz features 51 multiple-choice questions that cover demand and supply, market equilibrium, and related economic theories.Key Features:51 challenging questionsImmediate feedback on answersBoost your knowledge of economic principles","img":"https:/images/course5.png"}
More Quizzes
10 QUESTIONS ON INFLATION
10523
Economics Quiz 2020 Pretest
15831
Scrub Quiz
14748
TomTomTom
8440
Casper Meets Wendy Movie Trivia - Free Online
201016621
What Do I Want in a Relationship - Find Your Needs
201018259
Clock: 24-Hour Time Practice - Free Online
201022503
Beyond the Cold War - Free World History Practice
201016233
Japanese Beauty Standards Test - Find Your Type (Free)
201018259
WoW Race - Which World of Warcraft Race Are You?
201016621
Where in Canada Should I Live? Free City Match
201018968
Which Helluva Boss Character Are You? Take the
201018335