Market Analysis Quiz

A vibrant graphical representation of technical analysis charts, including candlestick patterns, Bollinger Bands, and trading indicators, set against a backdrop of financial market imagery.

Market Analysis Quiz

Test your knowledge of technical analysis and market principles with our engaging quiz. Designed for both beginners and seasoned traders, this quiz covers key concepts such as Dow Theory, Bollinger Bands, and chart formations.

By participating, you will:

  • Understand fundamental technical analysis terms.
  • Challenge your existing knowledge.
  • Learn new insights into market behaviors.
11 Questions3 MinutesCreated by AnalyzingEagle24
Name:
According to the work of Charles Dow and his successors, now referred to as Dow Theory, which of the following is NOT a hypothesis for the nature of markets and technical analysis?
A. The primary trend is inviolate.
B. The averages discount everything.
C. Dow Theory is not infallible.
D. Prices move at random.
In relation to the principles of technical analysis, the phrase “patterns are fractal” refers to the assumption that
A. Patterns tend to break existing trends.
B. Mandelbrot originated the concept of chart patterns.
C. Pattern analysis is universal and independent of time.
D. Chart patterns found in an intraday chart can generate signals in a daily chart.
The TRIN, or Arms Index, is calculated by
A. Dividing total specialist short sales by total short sales.
B. Subtracting the 26-day simple moving average from the 12-day simple moving average.
C. Subtracting the advance/decline ratio from the ratio of advancing volume to declining volume.
D. Dividing the advance/decline ratio by the ratio of advancing volume to declining volume.
When analyzing long term price movements, it could be helpful to use _______ chart.
A. A logarithmic
B. A candlestick
C. an EquiVolume
D. A point and figure
Objective technical analysis methods
A. Normally witness less drawdown.
B. Normally witness high drawdown.
C. Require a disciplined approach for success.
D. Are well-defined procedures that issue unambiguous signals.
An exponential moving average
A. Gives more weight to the most recent observation.
B. Gives less weight to the most recent observation.
C. Gives equal weight to all observations.
D. Does not suffer from any lag.
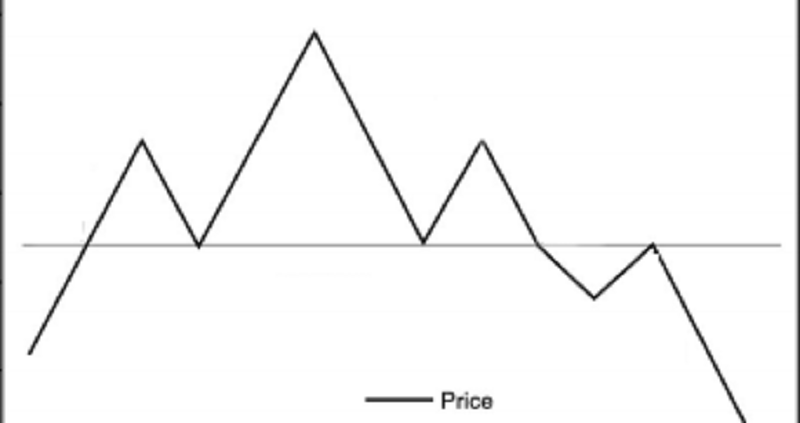
Identify the chart formation below.
A. Triple top
B. Rising wedge
C. Rounding top
D. Head and shoulders top
A narrowing of Bollinger Bands normally indicates that
A. A stock is ready for a rally.
B. A stock is ready for a decline.
C. A stock’s volatility has increased.
D. A stock’s volatility has decreased.
A breakaway gap usually
A. Provides a major divergence signal.
B. Signals the beginning of a new trend.
C. Occurs at the end of an important price move.
D. Occurs during the accumulation phase of the market cycle.
A flag is generally formed by a_______in a bull market or a_______in a bear market.
A. rally, pullback
B. rally, correction
C. correction, rally
D. correction, throwback
{"name":"Market Analysis Quiz", "url":"https://www.quiz-maker.com/QPREVIEW","txt":"Test your knowledge of technical analysis and market principles with our engaging quiz. Designed for both beginners and seasoned traders, this quiz covers key concepts such as Dow Theory, Bollinger Bands, and chart formations. By participating, you will: Understand fundamental technical analysis terms. Challenge your existing knowledge. Learn new insights into market behaviors.","img":"https:/images/course2.png"}
Powered by: Quiz Maker