Modules 5 and 6

Economic Insights Quiz
Test your knowledge on the intricacies of GDP and national income accounting with this comprehensive quiz. It covers various aspects of economics, including government purchases, net exports, and more.
Perfect for students and anyone interested in economics!
- 50 Thought-provoking questions
- Multiple choice format
- Enhance your understanding of economic concepts
1. The following data about a hypothetical economy are in billions of dollars.

Refer to the above data. GDP in this economy is:
$6,380 billion
$6,230 billion
$6,080 billion
$6,400 billion
2. The following are examples of final goods in national income accounting, except:
Laptop computer purchased by an executive for personal use
Tractor purchased by a construction company
Lumber and steel beams purchased by a construction company
Desktop computer purchased by an executive for business use
3. Government purchases in national income accounts would include payments for:
Public assistance for welfare recipients
Social Security checks to retirees
Unemployment benefits
Salaries for current Canadian military officers
4. O avoid multiple counting in national income accounts:
Both final and intermediate goods and services should be counted
Intermediate goods and services should be counted
Primary, intermediate, and final goods and services should be counted
Only final goods and services should be counted
5. To avoid multiple counting in national income accounts:
$3,846 billion
$3,925 billion
$4,379 billion
$4,108 billion
6. The following data about a hypothetical economy are in billions of dollars.

Refer to the above data. How much are net exports of this economy?
-$65 billion
+$20 billion
+$150 billion
-$20 billion
7.
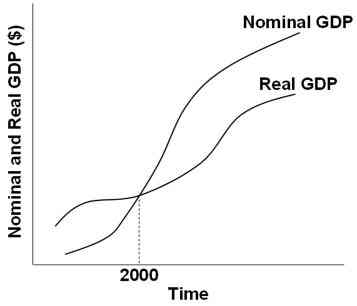
Refer to the graph above. The year 2000 must be the:
Point in time when GDP equaled 100
Year when the GDP price index is zero
Base year of the GDP price index
Year when depreciation or capital consumption equaled zero
8. A distinguishing characteristic of public transfer payments is that:
They involve no contribution to current production in return
They are counted as part of government purchases in the calculation of the gross domestic product
They include wages to government workers
They include the cost of maintaining public parks
9. (The following national income data for an economy are in billions of dollars.)
f1q59g1
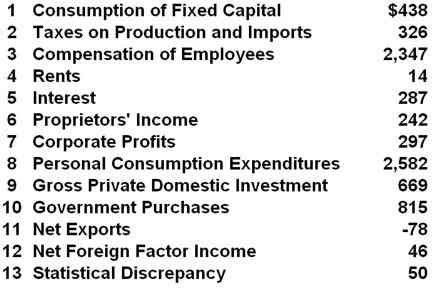
Refer to the above data. The expenditures approach to GDP calculation can be done by adding:
1 through 7
2 through 7
3 through 8
8 through 11
10. Nominal GDP is less than real GDP in an economy in both year 1 and year 2. In year 3, nominal GDP is equal to real GDP. In year 4, nominal GDP is slightly greater than real GDP. In year 5, nominal GDP is significantly greater than real GDP. Which year is the base year being used to calculate the price index for this economy?
3
2
4
5
11. "GDP price index" measures changes in the:
Cost of resources employed in the nation
Prices of the output produced in the nation
Value of final output produced in the nation
Amount of resources available in the nation
12. The "underground economy" is mostly made up of:
Tax-evasion activities
Do-it-yourself activities
Illegal activities
Unpaid work
13. GDP tends to underestimate the productive activity in the economy because it excludes the value of output from:
Intermediate goods
The underground economy
The consumption of fixed capital
Public transfer payments to households
14. The following are incomes earned but not received by the nation's households, except:
Corporate income taxes
Transfer payments
Social security contribution
Undistributed corporate profits
15. Gross domestic private investment, as defined in national income accounts, would include the following, except:
Changes to business inventories
The value of all capital goods bought by business firms
Government construction of new highways and dams
All domestic construction done by the private sector
16. Value added by a firm is the market value of the firm's output minus the:
Total costs of all inputs used
Profits that the firm's owners earn
Value of inputs bought from other firms
Total wages paid to its employees
17. When local police and fire departments buy new cars for their operations, these are counted as part of:
C
Ig
Xn
G
18. GDP in an economy is $11,050 billion. Consumer expenditures are $7,735 billion, government purchases are $1,989 billion, and gross investment is $1,410 billion. Net exports must be:
-$47 billion
-$84 billion
+$53 billion
-$161 billion
19. Which of the following is included in the expenditures approach to GDP?
Expenditures on used clothing at garage sales
Spending on meals by consumers at restaurants
Government spending on welfare payments
Value of stocks and bonds bought by businessmen
20. Which would be considered an investment according to economists?
A fishing-company owner buys new fishing gear
A fishing-company owner buys Google shares
A fishing-company buys a few boats from another fishing company that was closing out
A fishing-company owner buys fuel to run the boats
21. Consider the following data for a firm over a period of time. The contribution of the firm to domestic output by the value-added method is:

$50,000
$40,000
$45,000
$5,000
22. The total volume of business sales in our economy is several times larger than GDP because:
The GDP excludes intermediate transactions
The GDP grossly understates the value of our annual output
The GDP does not take taxes into account
Total sales are in money terms and GDP is always stated in real terms
23. Net exports is a positive number when:
A nation's exports of goods and services are increasing
A nation's exports of goods and services fall short of its imports
A nation's exports of goods and services exceed its imports
A nation exports goods and services to other nations
24. GDP does not include which of the following activities?
Households spending to enhance security of their neighborhoods
Businesses installing anti-pollution equipment
Families eating out in restaurants
Correct Couples remodeling their own homes
25. Subtracting the purchase of intermediate products and supplies from the value of the sales of final products determines the amount of:
Net investment for a business
Correct Value added from the economic activity
Surplus or deficit from the economic activity
Profit and cost
26. An increase in aggregate demand is most likely to be caused by:
A decrease in the tax rates on household income
A decrease in government spending
A decrease in expected returns on investment
An increase in real interest rates
27.
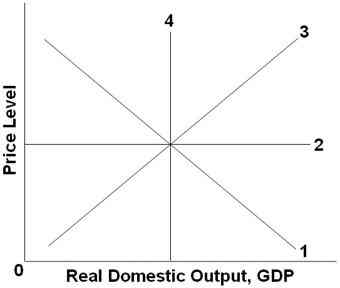
Refer to the graph above. The long-run aggregate supply curve would be represented by which line?
1
2
3
4
28. An aggregate supply curve represents the relationship between the:
Price level that producers are willing to accept and the price level buyers are willing to pay
Real domestic output bought and the real domestic output sold
Price level and the production of real domestic output
Price level and the buying of real domestic output
29.
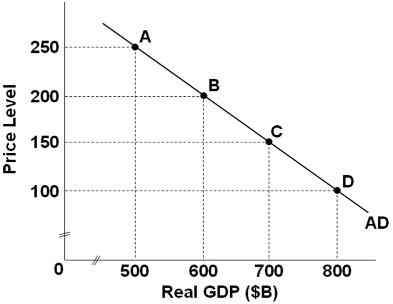
Refer to the graph above, which shows an aggregate demand. If the economy is at point C and the price level increases by 100, then the wealth, interest-rate, and foreign purchases effects will:
Move the economy to point B
Shift the AD curve to the left
Move the economy to point A
Move the economy to point D
30.
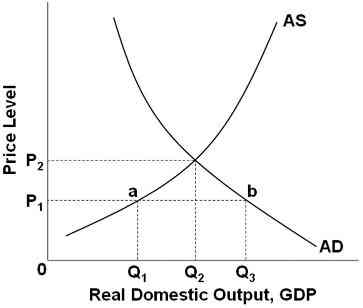
Refer to the graph above. The equilibrium for this economy is:
At point a
At point b
At price level P2 and output Q2
At price level P1 and output Q1
31. A decrease in government spending will cause a(n):
Increase in the quantity of real output demanded
Increase in aggregate demand
Decrease in aggregate demand
Decrease in the quantity of real output demanded
32. The real-balances effect on aggregate demand suggests that a:
Lower price level will decrease the real value of many financial assets and therefore cause an increase in spending
Higher price level will increase the real value of many financial assets and therefore cause an increase in spending
Lower price level will decrease the demand for money, decrease interest rates, and increase consumption and investment spending
Lower price level will increase the real value of many financial assets and therefore cause an increase in spending
33. The labels for the axes of an aggregate supply curve should be:
Real domestic output for the vertical axis and price level for the horizontal axis
Real domestic output for the horizontal axis and price level for the vertical axis
Real employment for the vertical axis and price level for the horizontal axis
Aggregate demand for the vertical axis and real national output for the horizontal axis
34.
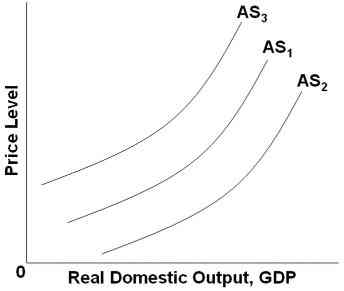
Refer to the graph above. Which of the following factors will shift AS1 to AS2?
An increase in input prices
A decrease in business subsidies
A decrease in business taxes
An increase in real interest rates
35. The table below shows the aggregate demand and aggregate supply schedules for a hypothetical economy.
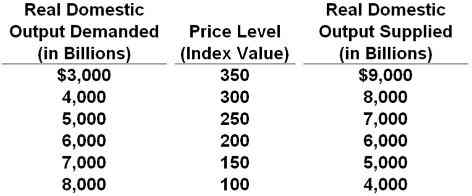
Refer to the table above. The equilibrium price and output levels will be:
200 and $6000
250 and $7000
200 and $5000
300 and $8000
36.
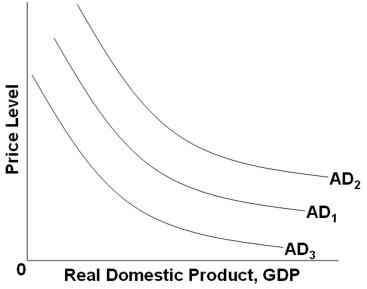
Refer to the graph above. Which of the following changes will shift AD1 to AD2?
An increase in real interest rates
A cut in personal and business taxes
A shrinkage in the value of stocks and other financial assets
An increase in the value of the dollar relative to other currencies
37. If personal income taxes and business taxes increase, then this will:
Increase aggregate demand and aggregate supply
Decrease aggregate demand and increase aggregate supply
Increase aggregate demand and decrease aggregate supply
Decrease aggregate demand and aggregate supply
38.

Refer to the graph above. Which of the following factors will shift AS1 to AS3?
An increase in input prices
A decrease in business taxes
A decrease in household indebtedness
An increase in productivity
39. When the excess capacity of business expands unintentionally, aggregate:
Demand will increase
Supply will increase
Demand will decrease
Supply will decrease
40. Which would most likely shift the aggregate supply curve? A change in the prices of:
Domestic products
Foreign products
Resources
Financial assets
41. An increase in productivity will:
Increase aggregate supply and aggregate demand
Increase aggregate supply
Decrease aggregate supply and aggregate demand
Increase aggregate demand
42.

Refer to the graph above. If the price level is initially at P1, then the economy will adjust by:
Reducing the price level
Decreasing the GDP produced
Increasing the total output demanded
Increasing output produced
43. The aggregate demand curve shows the:
Direct relationship between real-balances and the quantity of real GDP purchased
Inverse relationship between interest rates and the quantity of real GDP produced
Direct relationship between the price level and the quantity of real GDP produced
Inverse relationship between the price level and the quantity of real GDP purchased
44. The aggregate demand curve or schedule shows the relationship between the total demand for output and the:
Interest rate
Income level
Price level
Real GDP
45. The foreign purchases effect on aggregate demand suggests that a:
Rise in our domestic price level will increase our imports and reduce our exports, thereby reducing the net exports component of aggregate demand
Fall in our domestic price level will decrease our imports and increase our exports, thereby reducing the net exports component of aggregate demand
Fall in our domestic price level will increase our imports and reduce our exports, thereby reducing the net exports component of aggregate demand
Rise in our domestic price level will decrease our imports and increase our exports, thereby reducing the net exports component of aggregate demand
46. The foreign purchases, interest rate, and real-balances effects explain why the:
Aggregate demand curve may shift to the left or right
Aggregate demand curve is downward-sloping
Aggregate expenditures schedule may shift up or down
Economy will adjust towards equilibrium
47. It shows the aggregate demand and aggregate supply schedule for a hypothetical economy.
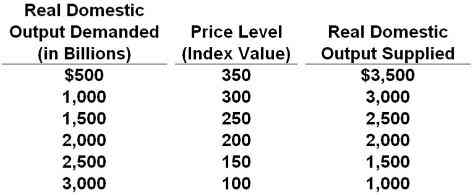
Refer to the table above. If the quantity of real domestic output demanded increased by $1000 at each price level, the new equilibrium price level and quantity of real domestic output would be:
200 and $2000
300 and $3000
150 and $2500
250 and $2500
48. T shows the aggregate demand and aggregate supply schedule for a hypothetical economy.

Refer to the table above. If the quantity of real domestic output demanded decreased by $500 and the quantity of real domestic output supplied increased by $500 at each price level, the new equilibrium price level and quantity of real domestic output would be:
150 and $2000
200 and $2000
150 and $1500
250 and $2000
49. The labels for the axes of the aggregate demand graph should be:
Price of a product on the vertical axis and quantity of a product on the horizontal axis
Real domestic output on the vertical axis and the price level on the horizontal axis
Real domestic output on the horizontal axis and the price level on the vertical axis
Quantity of a product on the vertical axis and the price of a product on the horizontal axis
50.

Refer to the graph above. Which line might represent an immediate-short-run aggregate supply curve?
1
2
3
4
{"name":"Modules 5 and 6", "url":"https://www.quiz-maker.com/QPREVIEW","txt":"Test your knowledge on the intricacies of GDP and national income accounting with this comprehensive quiz. It covers various aspects of economics, including government purchases, net exports, and more.Perfect for students and anyone interested in economics!50 Thought-provoking questionsMultiple choice formatEnhance your understanding of economic concepts","img":"https:/images/course5.png"}
More Quizzes
1-2 თავის ტესტები
1050
National income aggregates
6377
SPIM Valentine's Day Trivia
14715
Anesthesie-Reanimation
16482183
Radiographic Upper Extremity Anatomy - Test Skills
201054460
Test Your Skills with the Ultimate African Music!
201060497
Bree from Lab Rats: Only True Fans Score 100%
201028387
Scholarship Questions & Answers - Test Your Skills
201026712
Introduction to Field Methods
15833975
Free Biotechnology Worksheet
201026974
Personal Fashion: Unlock Your Signature Style
201027243
Free 5 Southern Colonies Practice
201023991