Stats Midterm Practice Test

Stats Midterm Practice Test
This quiz is designed for students preparing for their statistics midterm exam. It covers essential concepts and questions related to statistics, sampling, data interpretation, and measures of central tendency.
- 56 carefully crafted questions
- Multiple-choice format for easy answering
- Covers a wide range of statistical topics
A researcher is interested in the effect of amount of sleep on high school students’ exam scores. A group of 75 high school boys agree to participate in the study. The boys are _____.
A statistic
A variable
A parameter
A sample
Most research studies data from samples
True
False
When sample differs from the population there is a systematic difference between groups
True
False - sampling error due to random influence may produce unsystematic group difference
Research measurements are made using specific procedures that define constructs
True
False
Variables that cannot be measured directly cannot be studied scientifically
True
False - constructs (interval states) can only be observed indirectly, but can be operationally measured
A study assesses the optimal size (number of other members) for study groups. The variable size of group is _____.
Discrete and interval
Continuous and ordinal
Discrete and ratio
Continuous and interval
Researchers observed that students’ exam scores were higher the more sleep they had the night before. This study is _____.
Descriptive
Experimental comparison of groups
Non-experimental group comparison
Correlational
All research methods have an independent variable
True
False - correlational methods do not need an independent variable
All research methods can show cause-and-effect relationships
True
False - only experiments control the influence of participants and environmental variables
�X2 + 47 instructs you to _____.
Square each score and add 47 to it, then sum those squares
Square each score add up the squared scores, then add 47 to that sum
Add 47 to each score, square the result, and sum those numbers
Add up the scores, square that sum, and add 47 to it
�X2 = (∑X)2
True
False - when the operations are performed in a different order, the results will be different
(∑X) • (∑X) = (∑X)2
True
False

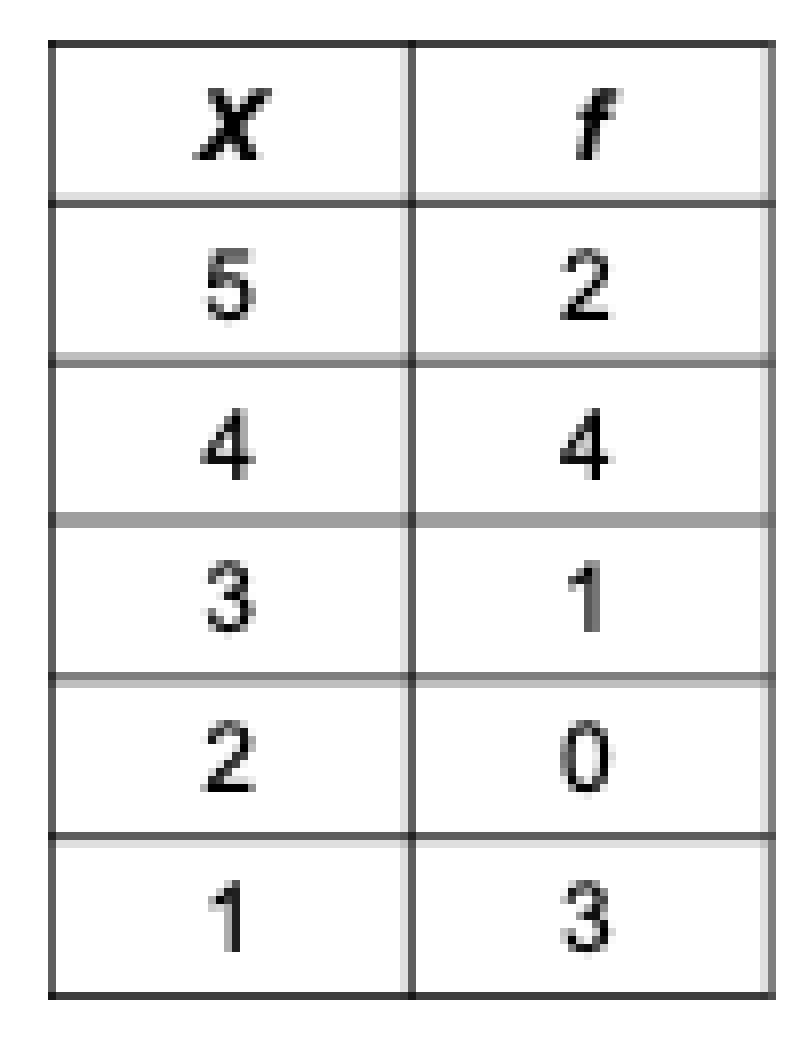
Use the frequency distribution table to determine how many subjects were in the study.
10
15
33
Impossible to determine

More than 50% of the individuals scored above a 3
True
False

The proportion of scores in the lowest category was p=3
True
False - a proportion is a fractional part; 3/10 = .3
A grouped frequency distribution table has categories 0–9, 10–19, 20–29, and 30–39. What is the width of the interval 20–29?
9 points
9.5 points
10 points (29.5-19.5 = 10)
10.5 points
You can determine how many individuals had each score from a frequency distribution table
True
False
You can determine how many individuals had each score from a grouped frequency distribution
True
False - only the number of individuals in the class interval is available once the scores are grouped

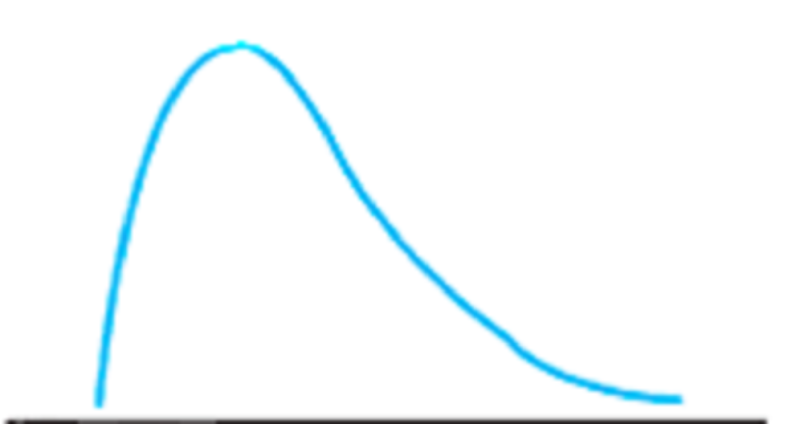
What is the shape of this distribution
Symmetrical
Negatively skewed
Positively skewed
Discrete
It would be correct to use a histogram to graph parental marital status data from a treatment center for children
True
False - nominal variable, requires bar graph
It would be correct to use a histogram to graph the time children spent playing with other children from data collected in a children's treatment center
True
False

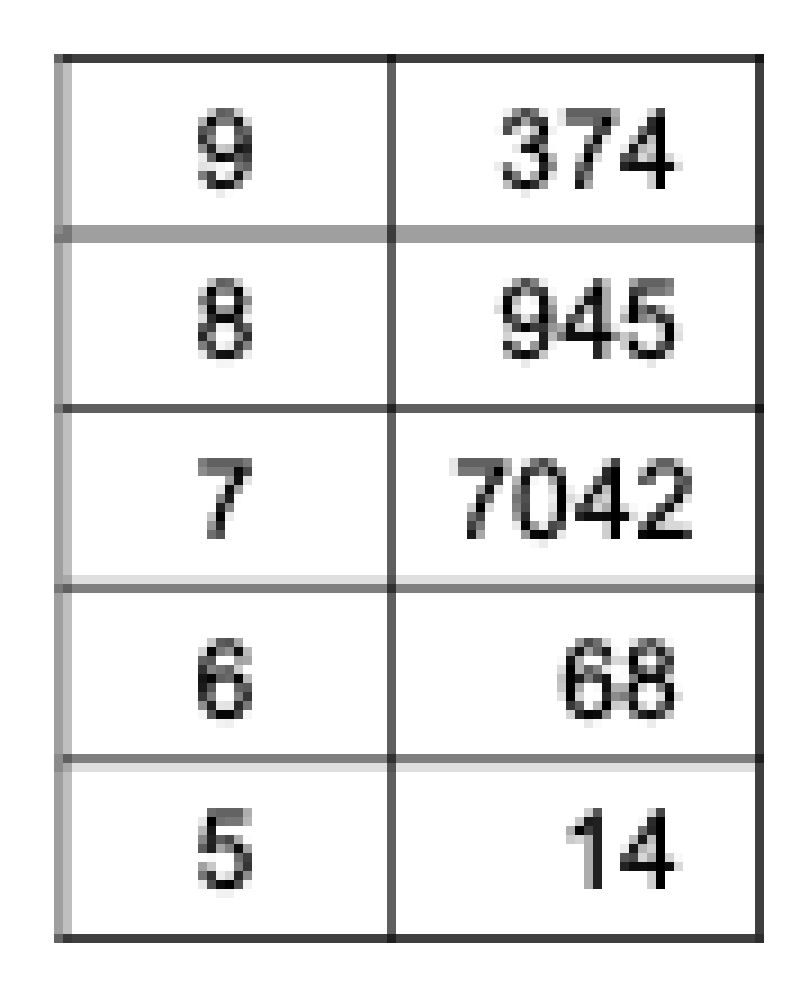
For the scores shown in the stem and leaf display, what is the lowest score in the distribution?
7
15
50
51
Any frequency distribution is suitable for a stem and leaf display
True
False - a stem and leaf display is a simple alternative for a grouped frequency distribution
A score of 54 is displayed as a 5 (stem) and 4 (leaf) in a steam and leaf display
True
False
A sample of n = 12 scores has a mean of M = 8. What is the value of ΣX for this sample?
1.5
4
20
96
A sample of n = 7 scores has M = 5. All of the scores are doubled. What is the new mean?
5
10
25
More information is needed
It is possible for more than 50% of the scores ins a distribution to have values above the mean
True
False
It is possible for more than 50% of the scores in a distribution to have values above the median
True
False - median is exactly half
A distribution of scores shows the mean = 31 and the median = 43. This distribution is probably _____.
Positively skewed
Negatively skewed
Bimodal
Open-ended
The mean uses all of the scores in the data, so it is the best measure of central tendency for skewed data
True
False - mean moves towards the tail so it may not be representative of the true middle
If the mean and median have the same values, the distribution is probably symmetrical
True
False
The computational and definitional formulas for SS sometimes give different results
True
False - computational formula is just an algebraic rearrangement of the definitional formula, results are identical
If all the scores in the data set are the same, the standard deviation is equal to 1
True
False - 0
The standard deviation measures the _____.
Sum of the squared deviation scores
Standard distance of a score from the mean
Average difference of a score from the mean
Average squared distance of a score from the mean
A sample of four scores has SS = 24. What is the variance?
6
7
8
12
A sample systematically has less variability than a population
True
False
The standard deviation is the distance from the mean to the farthest point on the distribution curve
True
False - extends from the mean approximately halfway to the most extreme score
A population has μ = 6 and σ = 2. Each score is multiplied by 10. What is the shape of the resulting distribution?
μ = 60 and σ = 2
μ = 6 and σ = 20
μ = 60 and σ = 20
μ = 6 and σ = 5
A biased statistic has been influenced by researcher error
True
False - bias refers to the systematic effect of using sample data to estimate a population parameter
On average, an unbiased sample statistics has the same value as the population parameter
True
False
A z-score of z = +1.00 indicates a position in a distribution _____.
Above the mean by 1 point
Above the mean by a distance equal to 1 standard deviation
Below the mean by 1 point
Below the mean by a distance equal to 1 standard deviation
A negative z-score always indicates a location below the mean
True
False
A score close to the mean has a z-score close to 1
True
False - close to the mean = close to 0
For a population with μ = 50 and σ = 10, what is the X value corresponding to z = 0.4?
50.4
10
54
10.4
If μ = 40 and 50 corresponds to z = +2.00, then σ = 10 points.
True
False - If z = +2, then 2σ = 10, so σ = 5
If σ = 20, a score above the mean by 10 points will have z = 1.00.
True
False - If σ = 20, then z = 10/20 = 0.5
A score of X = 59 comes from a distribution with μ = 63 and σ = 8. This distribution is standardized to a new distribution with μ = 50 and σ = 10. What is the new value of the original score?
59
45
46
55
Last week Andy had exams in chemistry and in Spanish. On the chemistry exam, the mean was µ = 30 with σ = 5, and Andy had a score of X = 45. On the Spanish exam, the mean was µ = 60 with σ = 6, and Andy had a score of X = 65. For which class should Andy expect the better grade?
Chemistry
Spanish
There is not enough information to know
Transforming an entire distribution of scores into z-scores will not change the shape of the distribution.
True
False
If a sample of n = 10 scores is transformed into z-scores, there will be five positive z-scores and five negative z-scores.
True
False - number of z-scores above/below the mean with be exactly the same as the number of original scores above/below the mean
A deck of 52 cards contains 12 royalty cards. If you randomly select a card from the deck, what is the probability of obtaining a royalty card?
P = 1/52
P = 12/52
P= 3/52
P = 4/52
Choosing random individuals who walk by you yields a random sample.
True
False - not all individuals walk by, so not all have an equal chance of being selected for the sample
Probability predicts what kind of population is likely to be obtained.
True
False - the population is given; probability predicts what a sample is likely to be like
Find the proportion of the normal curve that corresponds to z > 1.50.
P = 0.9332
P = 0.5000
P = 0.4332
P = 0.0668
For any negative z-score, the tail will be on the right-hand side.
True
False - negative z-scores the tail will always be on the left side
If you know the probability, you can find the corresponding z-score.
True
False
{"name":"Stats Midterm Practice Test", "url":"https://www.quiz-maker.com/QPREVIEW","txt":"This quiz is designed for students preparing for their statistics midterm exam. It covers essential concepts and questions related to statistics, sampling, data interpretation, and measures of central tendency.56 carefully crafted questionsMultiple-choice format for easy answeringCovers a wide range of statistical topics","img":"https:/images/course5.png"}
More Quizzes
WSC STATSTICS
10577
Stats and P-values
320
Fences Act 1
26130
Be the Villain for the Day to Find out Which Disney Villain you Are
11623
Microsoft Word Skills Test - Free Online
201020761
Out of the Dust Pages 30 - 69 - Free Online
201020552
Which Hormone Opposes Parathyroid Hormone? - Free
201023343
Mean Girls: Which Character Are You?
201017696
Inner Child Test - Discover Your Archetype (Free)
201017628
Could I Be an Actor - Find Your Professional Type
201016629
Nursing Clinical Competency - Free Online
201017905
Greek Mythology - Know the Gods & Goddesses
201021195