PSYC 232 Terms Test 2

Psychology Terms Mastery Quiz
Test your knowledge of essential psychology terms and concepts! This comprehensive quiz covers a variety of topics related to research methods, statistical analysis, and fundamental psychological concepts.
- Explore key definitions and applications.
- Challenge yourself with multiple-choice and checkbox questions.
- Perfect for students and psychology enthusiasts alike!
Define categorical nominal
Groups or categories that have labels
Used for mode
Used for median
Used for mean
Define ordinal ranked
Median
Data that can be ordered in an increase or decrease without meaningful breaks in data
Mean
Mode
What is an interval
Mode
Equal sized distances between data points. 0 point is not meaningful
Used for mean and SD
Median
What is a ratio
Median
Used for mean and SD
Mode
Equal sized distances between data points. 0 point means the absence of what your measuring
What is a conceptual replication
A type of replication of research using different procedures for manipulating or measuring the variables
Use same procedure
Different hypotheisis
Mode
What is scale relibailty
A type of replication of research using different procedures for manipulating or measuring the variables
The extent to which one can assume that performance on a set of items can generalize to performance on other items within the domain
Refers to the extent to which a scale can reproduce the same or similar measurement results in repeated trials
Define item relibabilty
The extent to which one can assume that performance on a set of items can generalize to performance on other items within the domain
Refers to the extent to which a scale can reproduce the same or similar measurement results in repeated trials
A type of replication of research using different procedures for manipulating or measuring the variables
Define cronbachs alpha
A measure of internal consistency
The extent to which one can assume that performance on a set of items can generalize to performance on other items within the domain
Refers to the extent to which a scale can reproduce the same or similar measurement results in repeated trials
How closely related a set of items are as a group. Anything above 0.7 is considered reliable
What is a significant Cronbachs alpha
0.5
0.01
1.0
0.7
What is a multiple regression
Determine's how well our predictor variables predict our outcome variable
A measure of internal consistency or, in simpler terms, how closely related a set of items are as a group.
Groups or categories that have labels u
Data that can be ordered in an increase or decrease without meaningful breaks in data
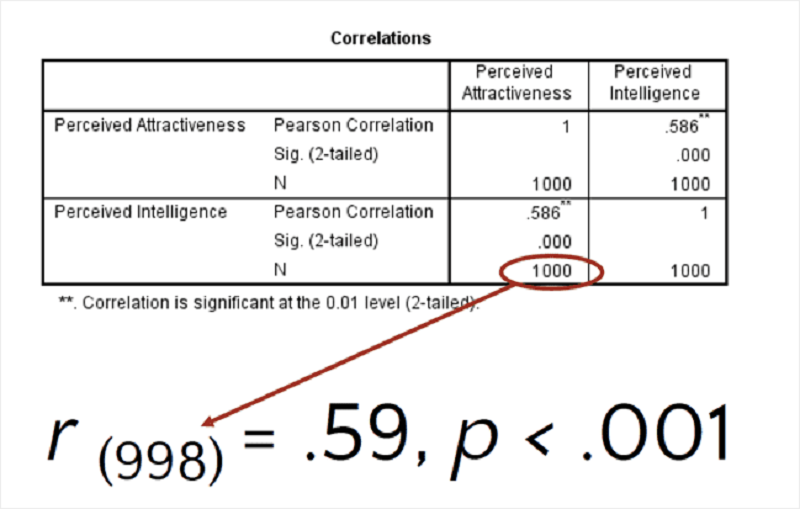
How do u get each of three values above
R (df). To get DF minus the N Value by 2 to get 998
The pearson correlation is the second value. And round to nearest db. To get .59
Sig (2 tailed) is the p value. If the value is .000 then put the p value as p<. .001
For the following correlation r (998) = .59, p < .001 what is the direction
Positive
Negative
For the following correlation r (998) = .59, p < .001 what is the Strength
.1 (small/Weak)
.3 (moderate)
.5 or larger (large/Strong)
For the following correlation r (998) = .59, p < .001 is the p value Significant
Yes
No
For the following correlation (r (802) = .11, p < .05). What is the direction
Positive
Negative
For the following correlation (r (802) = .11, p < .05) what is the Strength
.1 (small/Weak)
.3 (moderate)
.5 or larger (large/Strong)
For the following correlation (r (802) = .11, p < .05) is the p value Significant
Yes
No
For the following correlation (r (802) = .11, p < .05) results indicated a
Positive (direction)
Moderate (strength)
Weak (strength)
Signifcant p value
Chi-Square χ2
A test of the relationship or association between two categorical variables
Relationship between two continuous variables
Categorical data
Ordinal Data
What are the assumptions of Chi-Square
People’s measurements are independent to other people
No correlation
No relationship
There are at least five measurements in each cell (five of each possible combination of variables) - larger samples are good
Assumptions of pearsons correlation
People’s measurements are independent to other people
The variables are normally distributed (larger samples are good)
Your data do not have extreme outliers or non-linear patterns
All of the above
Assumptions of Independent Samples T Test
Independent observations
Normality
Homogeneity
All of the above
For the following research question "Are females more likely to be religious than males?" what are the null and alt hypothesis
Males and females are equally likely to be religious (Alt)
Males and females are equally likely to be religious (Null)
Females are more likely to be religious than males(Alt)
Females are more likely to be religious than males (null
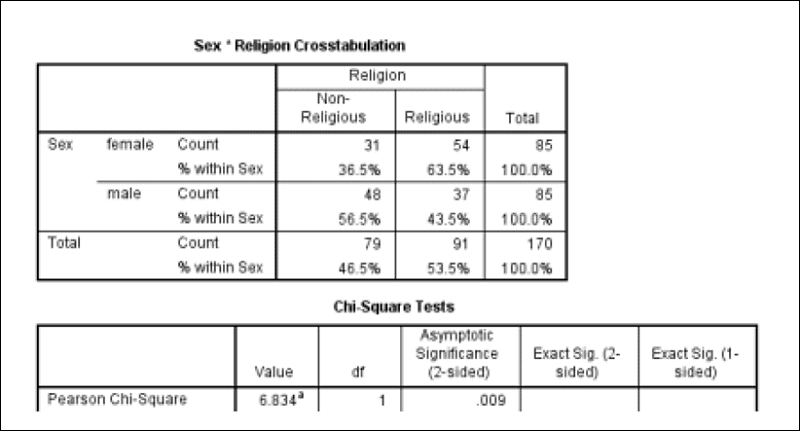
What is the apa result for the above chi square test
X2= 6.83
P = .009
Religous female percent =63.5%
Religous Male percent =43.5
What is a independent sample t test
Continuous differences between two groups (or two categories)
Relationship between categorical variables
Relationship between two continuous variables
What is a correlation
Relationship between categorical variables
Relationship between two continuous variable
Continuous differences between two groups (or two categories)
What is a chi squared test
Continuous differences between two groups (or two categories)
Continuous differences between two groups (or two categories)
Relationship between categorical variables
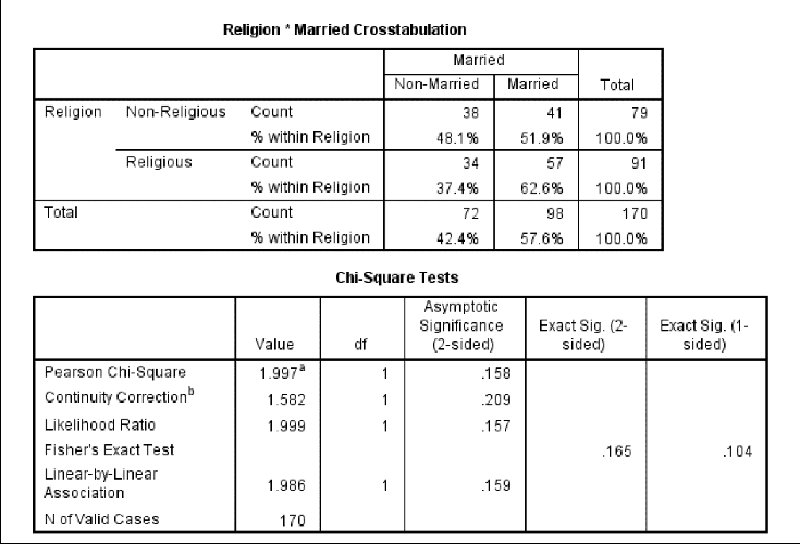
Comparing religious people and non-religious people, which group has the higher proportion of married people and is there a significant difference in this sample of people?
Non religious
Religious
Aliens
Not significant difference
Significant difference
What are the steps of Deductive Observational Coding
Step 1 Develop a theoretically-grounded coding schedule --> Step 2 Train coders and collect observational data--> Step 3 Assess validity and reliability of the observational data
Step 1 Develop a theoretically-grounded coding schedule---> Step 2 Assess validity and reliability of the observational data --> Step 3 Train coders and collect observational data

Inductive process and deductive process
Deductive process = theory --> hypothesis -->data
Inductive process= Data --> pattern identifcation and generalization ---> theory
Define Observational Coding
Measurement of an individual’s expressed behaviours, emotions, and/or speech made by objective coders
Develop a theoretically-grounded coding schedule
Train coders and collect observational data
What are the three steps of Observational Coding
Develop a theoretically-grounded coding schedule
Train coders and collect observational data
Assess validity and reliability of the observational data
What is step 1Deductive Observational Coding
Operationalize a psychological phenomenon (use prior theory and research)
Explain the coding schedule in detail (but not the hypothesis!)
Identify the behavioural and emotional components of that phenomenon
Provide example videos of behaviours on the coding schedule to the coders (“anchors”)
What is step 2 of Deductive Observational Coding
Provide example videos of behaviours on the coding schedule to the coders (“anchors”)
Explain the coding schedule in detail (but not the hypothesis!)
Identify the behavioural and emotional components of that phenomenon
Operationalize a psychological phenomenon (use prior theory and research)
What is step 3 of Deductive Observational Coding
Assess validity and reliability of the observational data
The extent to which different observers’ judgments are associated.
The extent to which your measurement actually measures what you say/think it measures
What is the demand coding schedule
Behavioural withdrawal (e.g., arms folded)
Making demands
Voicing complaints
� Criticizing the partner
� Interruption
Minimizing emotion
What is the withdrawl coding scehdule
Making demands
Minimizing emotion
Behavioural withdrawal (e.g., arms folded)
Hesitant or no response
Off-topic Conversation
Voicing complaints
The extent to which different observers’ judgments are associated is defined as
Inter-rater reliability
Observer agreement
Demand schedule
Disadvantages of Observational Methods
Time/Money on research
Naturalistic
Time/Money on particpants
Hawthorne Effect
How is Hawthorne Effect effect observational methods
Participating in any study may change behaviour; the strength of these changes depend on the context of the st
Participation requires coming into an observation space (or allowing one to be set up), usually higher $$$ compensation
Researching requires more vigilance regarding ethics, specialized equipment, training coders, data collection is slow
How does time/money effect particpants and research
Researching requires more vigilance regarding ethics, specialized equipment, training coders, data collection is slow
Participation requires coming into an observation space (or allowing one to be set up), usually higher $$$ compensation
Participating in any study may change behaviour; the strength of these changes depend on the context of the study
How is External Measurement an advantage in observational methods
Relatively objective, reliable measurement of behaviour, including of participants who cannot self-report (e.g., infants)
Video-recorded data can be re-coded to test new theories and research questions
The only way to obtain measures of people and animals as they actually live their lives Ecological validity
How does rich data benefit observational methods
The only way to obtain measures of people and animals as they actually live their lives Ecological validity
Relatively objective, reliable measurement of behaviour, including of participants who cannot self-report (e.g., infants)
Video-recorded data can be re-coded to test new theories and research questions
Define Naturalistic advantage for observational methods
Relatively objective, reliable measurement of behaviour, including of participants who cannot self-report (e.g., infants)
The only way to obtain measures of people and animals as they actually live their lives Ecological validity
Video-recorded data can be re-coded to test new theories and research questions
Coder drift
Over time, observer’s coding can be inconsiste
Observers learn different “anchor points” for high and low levels of behaviour after more varied exposure
Experience increases coding ability
� Boredom decreases coding ability
How does boredom effect coder drift
Decrease coding ability
Decrease coding ability
How does experience effect coder drift
Decrease coding ability
Increase coding ability
What is the Fisher exact test
A test used instead of chi-square if sample size is small or some cells in contingency table have no observations
Predicting a score on one variable using another variable
Individuals measurements are independent to others,
There are at least 5 measurements in each category
Is the intercept the mean of the outcome
True
False
What are predictors
The mean of the outcome
Variables that when used can improve the accuracy of the predicted value
How much are all of your predictors associated with your outcome
What is the R value
How much are all of your predictors associated with your outcome
The mean of the outcome
From 0-1 no variance is predicted explained by the model to all variance is predicted explained by the model
What is r2/rsquared
From 0-1 no variance is predicted explained by the model to all variance is predicted explained by the model
How much are all of your predictors associated with your outcom
What is Adjusted R-squared
A correction of R square for adding more than one predictor the left over (out of 0-1) is error
From 0-1 no variance is predicted explained by the model to all variance is predicted explained by the model
How much are all of your predictors associated with your outcom
Define variance
An indicator of the accuracy with which a series of antecedent variables can predict the values of a dependent variable. (think of plinko machines)
A correction of R square for adding more than one predictor the left over (out of 0-1) is error
Define Unstandardized B
Per 1 unit, the model predicts an increase by (B's) amount
B = .84, SE = .03, β = .71, t = 31.87, p < .001) )
The amount of standard deviation unit change in the outcome associated with one standard deviation unit change in the predictor variable
Define Standardized Beta (β)
Per 1 unit, the model predicts an increase by (B's) amount
A correction of R square for adding more than one predictor the left over (out of 0-1) is error
Comparable across predictors in the same regression
The amount of standard deviation unit change in the outcome associated with one standard deviation unit change in the predictor variable
What is Constant/Intercept
Prediction of dependent variable when independent variable is zero
Comparable across predictors in the same regression
Predictors have to explain variance in the outcome over and above the other predictors
What is Multiple Regression
Predictors have to explain variance in the outcome over and above the other predictors
Prediction of dependent variable when independent variable is zero
Comparable across predictors in the same regression
What is Regression to the Mean
If the first measurement is extreme, second measurement will be closer to the true mean
Each measurement in the sample is independent.
Variables are normally distributed.
What are the assumptions of regression
Each measurement in the sample is independent.
Variables are normally distributed
Predictors are linearly related to the outcome.
Variances of the residuals are random.
All of the above
Who was William Gosset
Worked for Guinness and tested beer samples using the T test
A ghost
Idk
What is a standard error
The size of the standard deviation and how close your sample is to the mean (e.g. Big standard error wide, small standard error thin)
How spread out is your sample
What is the standard deviation of sample
How spread out is your sample
The size of the standard deviation and how close your sample is to the mean (e.g. Big standard error wide, small standard error thin)
What is a independent samples t-test
Tests whether two means of individual groups are different from each other
A test used to compare two means from within the same group
One variable is categorical (e.g., Gender)
One variable is ordinal or continuous (e.g., Height)
What is a paired samples t-test
Tests whether two means of individual groups are different from each other
A test used to compare two means from within the same group
A test used to compare two means from within the same group
How spread out your scores are within your sample
What is a Anova Test
A test used to compare two means from within the same group
Tests whether two means of individual groups are different from each other
What is a one sample t test
How spread out your scores are within your sample
Used to determine if a single sample mean is different from a known population mean
A test used to compare two means from within the same group
A test used to compare two means from within the same group
What is variance
How spread out your scores are within your sample
A test used to compare two means from within the same group
How much two variables vary together
What is co variance
How much two variables vary together
A test used to compare two means from within the same group
How spread out your scores are within your sample
What is the apa question for regression
F (df of regression, df of the total) = Value for F, p-value
F (df of regression, df of the total) = t, F, p-value
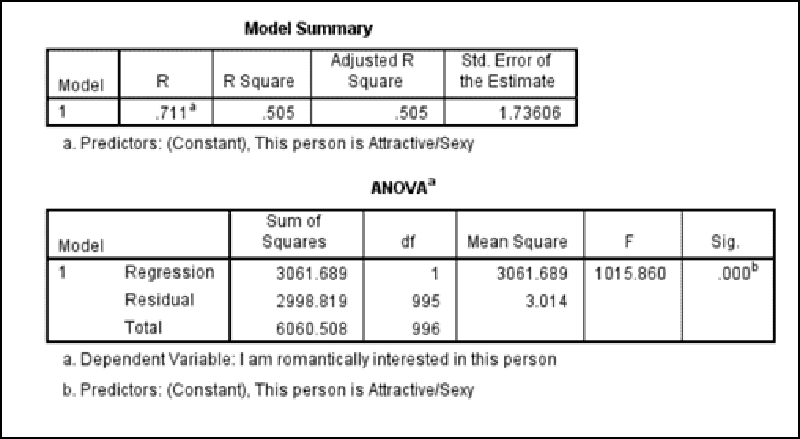
Use the equation F (df of regression, df of the total) = Value for F, p-value for the regression above
F (1, 996). regression = 1, total = 996
Value for f =1015.86
P < .001= since sig is .000 p value is .001
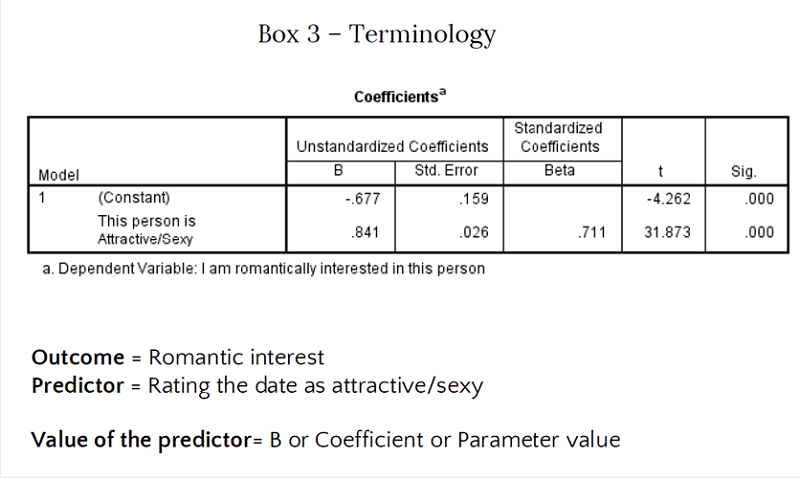
How do use the dependant and independent variable
Dependent is for the predictor
Dependent is for the outcome
In Dependent is for the predictor
Independent is for the outcome

What are the regrssion models for above
Predicted Romantic Interest = intercept + attractiveness of date + error
Rating the date = interecept + romantic interest + error
Predicted Romantic Interest = -.68 + .84 x attractiveness of date + error
Longitudinal “Lagged” Regression model
Negative Relationship Behaviour = intercept + Conflict + error
Negative Relationship Behaviour = + error +Conflict + intercept
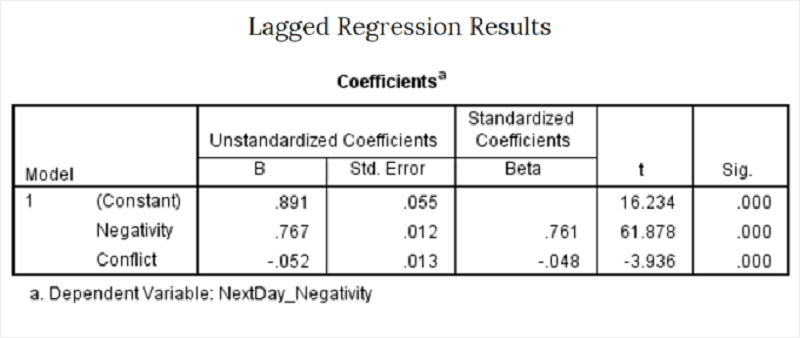
A one-unit increase in Conflict on one day is associated with a decrease in Negativity the Next Day of .052 units.
A one-unit increase in Negativity on one day is associated with an increase in Negativity the Next Day of .767 units,
N other words, there is high consistency of levels of negativity each day, controlling for levels of conflict.
All of the above
What are the advantages of “Lagged” Regression model
Provides stronger evidence (not causal evidence unless it’s experimental) for the direction of statistical relationships
Participation requires a greater amount of sustained motivation to complete surveys or repeatedly attend for in-person studies
Researching requires more cost for compensating participants, more work to co-ordinate different data points, data collection is slower
What are the disadvantages of “Lagged” Regression model
Researching requires more cost for compensating participants, more work to co-ordinate different data points, data collection is slower
Participation requires a greater amount of sustained motivation to complete surveys or repeatedly attend for in-person studies
Provides stronger evidence (not causal evidence unless it’s experimental) for the direction of statistical relationships
What are the important confounds of “Lagged” Regression model
Hisorical/societal effects
Testing/practis/learning effects
Normative developmental effects
What are Historical/societal effects for “Lagged” Regression model
An external event may effect variables in some or all of your sample, during the study
Changes in variables may be due to other factors in lifespan development
Participants’ task performance may change, or answers may change, because they completed the task before or answered questions
What are testing/practise/learning effects for “Lagged” Regression model
Changes in variables may be due to other factors in lifespan development
An external event may effect variables in some or all of your sample, during the study
Participants’ task performance may change, or answers may change, because they completed the task before or answered questions
what are Normative developmental effects for “Lagged” Regression model
Changes in variables may be due to other factors in lifespan development
Participants’ task performance may change, or answers may change, because they completed the task before or answered questions
An external event may effect variables in some or all of your sample, during the study
Define instrument decay
Loss of participants over time
Measures, equipment or observers/experimenters becoming better or worse over tim
Extreme values are more likely to be less extreme when measured again
Define regression to the mean
Measures, equipment or observers/experimenters becoming better or worse over tim
Extreme values are more likely to be less extreme when measured again
Loss of participants over time
Define sample attention
Loss of participants over time
Extreme values are more likely to be less extreme when measured again
Measures, equipment or observers/experimenters becoming better or worse over tim
How are you feeling for the test
Great
Good
Bad
FML
{"name":"PSYC 232 Terms Test 2", "url":"https://www.quiz-maker.com/QPREVIEW","txt":"Test your knowledge of essential psychology terms and concepts! This comprehensive quiz covers a variety of topics related to research methods, statistical analysis, and fundamental psychological concepts.Explore key definitions and applications.Challenge yourself with multiple-choice and checkbox questions.Perfect for students and psychology enthusiasts alike!","img":"https:/images/course8.png"}
More Quizzes
OMT 2 2223 Vragen uit handboek
77380
Chapter 2-3 PSYCH
17836
Which Greek God Is Your Parent?
10515
Bubonic Plague Quiz
6327
Fruit of the Spirit for Adults - Test Your Knowledge
201017612
Why Am I Always Tired
201016674
What's My Curse? Try the Curse Breaker
201018252
General Knowledge Football - Free to Play Online
201017545
Am I a Drama Queen? - Free Self-Assessment
201018959
Indiana MPJE Practice Questions - Free Pharmacy Law
201019747
Black Lives Matter (BLM) - Test Your Knowledge
201020839
Wedding Trivia: Multiple-Choice Questions & Answers
201017479
